Download

1 / 6
60 likes | 84 Views
Enhance project productivity with three core earned value measures - BCWS, BCWP, ACWP. Create a VB macro to sum data on capitalized tasks for reporting in MS Access. Reporting on deliverables, project status, budget & schedule indicators, and cost analysis.

E N D
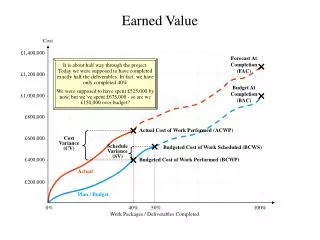
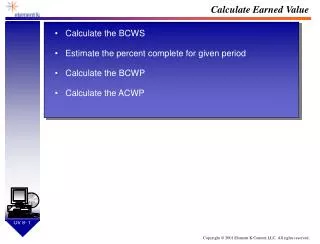
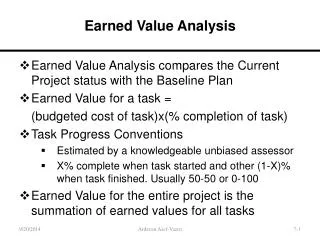
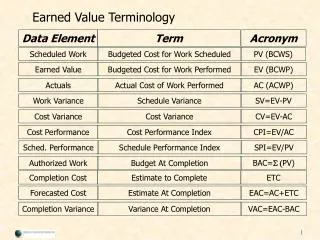
Earned Value Analysis Measures performance (productivity) as of a specific date in the life of the project. • Three Core Earned Value Measures • Planned Value (BCWS) - the amount of baseline costs that was scheduled to be spent on work up through the status date. • Earned Value (BCWP) - The earned value is that part of the planned value that has already been earned by the amount of work performed as of the status date. • Actual Cost (ACWP) – The actual cost of the work which has been completed as of the status date.
Reporting Requirements • Capitalized Labor Only (Mapped to AR) • Technical Design, Construction, Test and Implementation activities for Application Development resources are capitalized. • Infrastructure resources are not capitalized regardless of the activity/phase. • Business/User Requirements and End User Training activities are not capitalized. • Hardware and /or purchased software costs are not included in the report.
Solution Create a visual basic macro which, utilizing custom fields, filters and views, will sum information for only the “capitalized” tasks and export the data to MS Access for reporting.
Report Fields Deliverable Manager – as defined in File / Properties / Manager Project Number – as defined in File / Properties / Subject Status Date – as defined in Project / Project Information / Status Date Project Name – as defined in File / Properties / Title Budget Indicator – Green = Forecast is less than or equal to budget plus 5%. Yellow = Forecast is less than or equal to budget plus 10%. Red = Forecast is greater than 10% over budget. Schedule Indicator – Green = The current project finish date is either on or ahead of planned schedule. Yellow = The current project finish date is behind schedule by 10 calendar days or less. Red = the current project finish date is more than 10 calendar days behind schedule. Actual Cost to Date = Actual Cost – Adjustment to Actual Cost B/(W) Actual vs Budget to Date = BCWS – (Actual Cost – Adjustment to Actual Cost) B/(W) Forecast vs Budget = (Baseline Cost – Adjustment to Baseline Cost) – (Cost – Adjustment Actual Cost) % Complete – (Actual Work / Work ) X 100 B/(W) % Complete – ((Actual Work / Work) X100) – ((Baseline Work to Date / Baseline Work) X 100) B/(W) Imp Date – Imp Task Finish Variance Imp Date – Imp Task Schedule Finish