Download
1 / 53
530 likes | 802 Views
PREMATURITY: A Public Health Problem. Charleta Guillory, MD, FAAP Associate Professor of Pediatrics Baylor College of Medicine Associate Director of Level II Nurseries and Director of Texas Children’s Hospital Neonatal-Perinatal Public Health Program.

E N D
PREMATURITY: A Public Health Problem Charleta Guillory, MD, FAAP Associate Professor of Pediatrics Baylor College of Medicine Associate Director of Level II Nurseries and Director of Texas Children’s Hospital Neonatal-Perinatal Public Health Program
Texas Children’s Hospital is No. 4 among the nation’s pediatric hospitals and No. 3 in heart and neonatology specialties. The hospital was named the No. 1 pediatric hospital in the South and Southwest.
INFANT MORTALITYUNITED STATES, 1915-2001 Rate per 1,000 live births Source: National Center for Health Statistics, final mortality data Prepared by March of Dimes Perinatal Data Center, 2003
INFANT MORTALITY The Center for Disease Control’s National Center on Health Statistics recently reported that infant mortality increased from a rate of 6.8 infant deaths per 1,000 live births in 2001 to a rate of 7.0 per 1,000 births in 2002. The first year since 1958 that the rate has not declined or remained unchanged.
Selected Leading Causes of Infant Mortality United States, 1990and 2000 Rate per 100,000 live births Source: National Center for Health Statistics, 1990 final mortality data and 2000 linked birth/infant death data Prepared by March of Dimes Perinatal Data Center, 2002
INFANT MORTALITY RATES BY RACE/ETHNICITY: OKLAHOMA, 1999-2001 AVERAGE
CURRENT DEFINITIONS • Birth Weight • Low Birth weight (LBW) - < 2500 grams or 5.5 lbs • Very low birth weight (VLBW) - < 1500 grams or 3.3 lbs • Gestation Length • Premature (preterm delivery, PTD) - < 37 weeks • Early preterm delivery - < 32 weeks
OVERLAP IN LBW, PRETERM AND BIRTH DEFECTS U.S. (2002) Preterm Births 12.1% Low Birthweight Births 7.8% Among LBW:2/3 are preterm Among preterm:almost 50% are LBW (some preterm are not LBW) Birth Defects ~3-4%
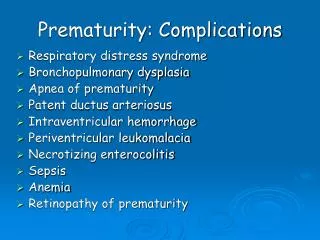
PREMATURITY • Premature birth is the # 1 killer of newborn babies • Leading cause of neonatal mortality (0-27 days of life) in U.S. • Second leading cause of infant mortality in U.S. • Major determinant of serious health problems: • Blindness • Mental retardation • Lung disease • neurologic problems
PREMATURITY: AN AMERICAN CRISIS • 480,812 babies/year born preterm in 2002 • Approximately 7,000 babies/year born preterm in Oklahoma (12.7 % of live births) • 100,000 babies/year end up with lifelong conditions:
PRETERM BIRTHSUNITED STATES, 1981, 1991, 2001, 2002 Percent March of Dimes Objective Healthy People Objective 27 Percent Increase 1981-2001 Source: National Center for Health Statistics, final natality data Prepared by March of Dimes Perinatal Data Center, 2004
Preterm Birth Rates by State United States, 2002 U.S Rate = 12.1% Note: Value in ( ) = number of states (includes District of Columbia) Value ranges are based on equal counts Source: National Center for Health Statistics, 2002 final natality data Prepared by March of Dimes Perinatal Data Center, December 2003
PRETERM BIRTHS (<37 WEEKS)BY MATERNAL RACE/ETHNICITY, US, 2001 Percent Preterm is less than 37 weeks gestation Hispanics can be of any race Source: National Center for Health Statistics, 2000 final natality data Prepared by March of Dimes Perinatal Data Center, 2002
RISK FACTORS FOR PRETERM LABOR/DELIVERY • The best predictors of having a preterm birth are: • current multifetal pregnancy • a history of preterm labor/delivery or prior low birthweight • mid trimester bleeding (repeat) • some uterine, cervical and placental abnormalities • Other risk factors: • multifetal pregnancy • maternal age (<17 and >35 yrs) • black race • low SES • unmarried • previous fetal or neonatal death • uterine abnormalities • incompetent cervix • genetic predisposition • low pre-pregnant weight • obesity • infections • bleeding • anemia • major stress • lack of social supports • tobacco use • illicit drug use • alcohol abuse • folic acid deficiency
FACTORS THAT CONTRIBUTE TO INCREASING RATES OF PRETERM BIRTH • Increasing rates of births to women 35+ years of age • Increasing rates of multiple births • Indicated deliveries • Induction • Enhanced management of maternal and fetal conditions • Patient preference/consumerism • Substance abuse • Tobacco • Alcohol • Illicit drugs • Bacterial and viral infections • Increased stress (catastrophic events, DV,racism)
MULTIPLE BIRTH RATIOS BY RACE*UNITED STATES, 1980-2001 Ratio per 1,000 live births *Race of child from 1980-1988; Race of mother from 1989-2001 Source: NCHS, final natality data, 1980-2001 Prepared by March of Dimes Perinatal Data Center, 2003
PRETERM BIRTHSAMONG MULTIPLE DELIVERIES: OKLAHOMA, 1992-2002
SMOKING AMONG WOMEN OF CHILDBEARING AGE: OKLAHOMA, 1999-2003
IMPACT OF SMOKING • Smoking during pregnancy is responsible for: • 20% of all LBW • 8% of preterm births • 5% of all perinatal deaths • Pregnant smokers compared to nonsmokers are: • 2.0-5.0 times as likely to experience PPROM • 1.2-2.0 times as likely to deliver preterm • 1.5-10 times as likely to deliver a SGA infant • 1.5-3.5 times as likely to deliver a LBW infant • Smoking increases risk of stillbirth (RR=1.4-1.6) • Risk increases with increased amount smoked • Smoking during and after pregnancy increases risk for SIDS by 3-fold
Prematurity Generates Enormous Health Care Costs • Average lifetime medical expenses for a preterm baby = $500,000 • The total national hospital bill for in patient hospital stays with any diagnosis of prematurity/low birthweight was estimated at $13.6 Billion in 2001 • Hospital charges for all infants = $29.3 Billion in 2001. Prematurity makes up almost half of all infant hospital costs • The average hospital charge for a preterm baby is $75,000 per stay, compared to $1,300 for an uncomplicated newborn stay. • Maternity & related expenses: Often the largest cost to employers’ health care plans * Source: Agency for Healthcare Research and Quality, 2001 Nationwide Inpatient Sample Prepared by March of Dimes Perinatal Data Center, 2003
What are the adverse short and long-term outcomes that these extremely immature infants are at risk to develop?
INFANT’S BORN AT 22 – 25 WEEKS New England Journal of Medicine 2000;343:378-84
ODDS RATIO FOR ADVERSE OUTCOME New England Journal of Medicine 2000;343:378-84
OVERALL COGNITION New England Journal of Medicine 2005;352:9-19.
NEUROMUSCULAR New England Journal of Medicine 2005;352:9-19.
VISION DISABILITY New England Journal of Medicine 2005;352:9-19.
HEARING DISABILITY New England Journal of Medicine 2005;352:9-19.
LONG-TERM OUTCOMES Very Low Birth Weight (VLBW) infants have poorer cognitive and behavioral outcomes at school age compared to normal birth weight infants.
COGNITIVE AND BEHAVIORAL OUTCOME OF SCHOOL AGED CHILDREN BORN PRETERM: A META-ANALYSIS Bhutta, et al, JAMA, 2002 • Studies from 1980-2001- English language literature • N = 1556 preterm infants vs 1720 term controls • Infants evaluated after age of 5 years • Term controls had significantly higher cognitive scores than preterm infants • Preterm born children showed more than twice the relative risk for developing ADHD.
LONG-TERM OUTCOMES VLBW infants are associated with educational disadvantage that persists into early adulthood.
Outcomes in Young Adulthood of Very Low Birth Weight InfantsHack, et al. NEJM, 2002 • Cohort of 272 VLBW infants vs 233 control infants of normal birth weight • Born 1977-1979 - Assessed at 20 yrs of life • Fewer graduated from high school (74% vs 83%) • Lower mean IQ (87 vs 92) & lower academic achievement scores • Higher rates subnormal height (10% vs 5%) • More psychopathology among VLBW young adults than among control subjects
The prevention or amelioration of disabilities in survivors of extreme prematurity remains one of the most important challenges in medicine!
CAVEAT These results should be interpreted with the caution since neonatal care and outcomes for VLBW infants are different today than 20 years ago. However, the risk for potential impairments underscores the need for anticipatory guidance and early intervention in this population.
CAN PRETERM LABOR BE PREVENTED? • Primary prevention is the goal • especially risk reduction in the preconceptional period and early in pregnancy • Preterm prevention programs have focused on riskassessment or prediction of preterm labor • risk assessment identifies only half of preterm births • during pregnancy most biomarkers, even in combination with risk factors, do not have good positive predictive values • Causation is the great unknown
WHAT INTERVENTIONS MAY WORK? “Most interventions designed to prevent preterm birth . . .are not universally effective and are applicable to only a small percentage of women at risk for preterm birth.” “A more rational approach to intervention will require a better understanding of the mechanisms leading to preterm birth.” Goldenberg RL, et al. Prevention of preterm birth. NEJM 339 (5):313-20, 1998.
POTENTIAL INTERVENTIONS • Early, comprehensive, accessible, culturally sensitive prenatal care • Educate all pregnant women about preterm labor signs and symptoms and what to do if they occur • Screen and treat all UTIs and STIs • Identify cigarette smokers and intervene (5As) • Assess for alcohol use and intervene • Identify illicit substance users and intervene • Assess for domestic violence and intervene • Eliminate folic acid deficiency • Reduce major stress levels early and throughout pregnancy
“. . . . . Although we have come a long way in understanding the mechanisms involved in the pathogenesis of prematurity, we have a long way to go.” Lockwood CJ. Predicting premature delivery--No easy task. NEJM, 2002, 346 (4):282-4.
JANUARY 30, 2003MARCH OF DIMES PREMATURITY CAMPAIGN • Raise awareness • Reduce rates of preterm birth
PRETERM BIRTH LEGISLATION INTRODUCED “PREEMIE Act”,authorizes expansion of research into the causes and prevention of prematurity and increases federal support of public and health professional education as well as support services related to prematurity.