Download
1 / 18
190 likes | 347 Views
Jackson Blue Spring Hydrologic Data and Measurements. NWFWMD Kris Barrios January 14, 2010. Blue Spring NWFWMD Hydrologic Data Collection. Completed Blue Spring basin refinement LiDAR elevation mapping Ground water chemical characterization of the Blue Spring Basin Ongoing Monitoring

E N D
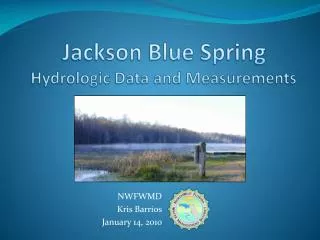
Jackson Blue Spring Hydrologic Data and Measurements NWFWMD Kris Barrios January 14, 2010
Blue Spring NWFWMD Hydrologic Data Collection • Completed • Blue Spring basin refinement • LiDAR elevation mapping • Ground water chemical characterization of the Blue Spring Basin • Ongoing Monitoring • Quarterly springs water quality and discharge • Continuous ground water level • Continuous rainfall • Quarterly ground water level measurements • Randomized ground and surface water quality
Summary of Blue Spring Measured Discharge NWFWMD and USGS Data
Merritt’s Mill Pond Submerged Springs – Discharge Measurements July 2007 Blue Spring = 39.1 cfs Shangri-La Spring = 3.87 cfs Twin Caves Spring = 1.60 cfs Hole-in-the-Wall Spring = 1.28 cfs Gator Hole Spring = 0.93 cfs Heidi Hole Spring = 0.16 cfs Total Measured Springs = 46.9 cfs Merritt’s Mill Pond Outflow = 56.3 cfs
Blue Spring as a Component of Merritt’s Mill Pond Outflow Discharge (cfs) date Blue Spring Averages ~ 70%
Elevation = 75.64’ NAVD Merritt’s Mill Pond Outflow Control Structure
Relationship of Merritt’s Mill Pond Elevation to Blue Spring Discharge
For Discharge in Cubic Feet per Second Q (flow) = Pipe Area * √(32.17*h) h Q
Determining Ground Water Level 50’ 45’ 31’ 30’
Potentiometric Surface: A visual representation of the elevation of the water table relative to sea level.
Blue Spring Discharge December 2004 – December 2009 Average = 113 cfs, 73 million gallons per day Maximum = 283 cfs, August 10-11, 2005 Minimum = 28 cfs, December 17-20, 2007