Download
1 / 50
541 likes | 769 Views
Learn To Trade Class #4 Plan Your Trade, Trade Your Plan. Wave Guidelines & Trading Tactics. Today we’ll discuss specific trading strategies based on specific positions within the wave count. We will begin at 7:30PM ET (-5 GMT) – You will hear no sound until we start

E N D
Learn To Trade Class #4 Plan Your Trade, Trade Your Plan Wave Guidelines & Trading Tactics Today we’ll discuss specific trading strategies based on specific positions within the wave count. We will begin at 7:30PM ET (-5 GMT) – You will hear no sound until we start The webinar will last between 1 ½ to 2 hours Tuesday July 30th, 2013
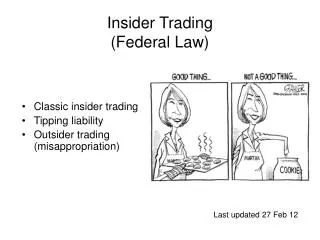
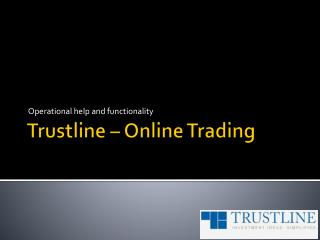
Specific Wave Guidelines 5 5 3 B 3 Wave 5 Wave A 4 1 Wave 4 Wave B Wave 1 Wave C 2 1 4 Wave 3 A Wave 2 C Wave 1 2
Wave One Guidelines • Price Structure • Should subdivide in 5 smaller degree waves. • Will be either impulse or leading diagonal. • Ratios & Relationships • Should coincide with shallow retracement from • larger-degree wave (i.e. 23.6% or 38.2%). • Trading Tactics • Be very selective trading. Too little is known about • newly formed motive wave. If anything, short • completion into Wave 2 lower.
Wave One Guidelines • Price Structure • Should subdivide in 5 smaller degree waves. • Will be either impulse or leading diagonal.
Wave One Guidelines • Ratios & Relationships • Should coincide with • shallow retracement • from larger-degree • wave (i.e. 23.6% or • 38.2%).
Wave One Guidelines Motive Wave Tip Right mouse click on the trendline, select “Properties” , “General”, “show info” • Trading Tactics • Be very selective trading. • Little is known about • newly formed motive • wave. • Wave 1 should be larger • than previous corrections. • Consider short entries at • end of smaller W5 of • larger W1 into larger W2.
B A C Specific Wave Guidelines 5 B 3 Wave 5 Wave A Wave 4 Wave 2 Wave B Wave C 1 4 Wave 3 A Wave 2 C Wave 1 2
Wave Two Guidelines • Price Structure • Price structure usually an A-B-C Zig-Zag formation. • Extreme bearishness as Wave 1 lows are approached. • Wave 1 low can NOT be exceeded. • Ratios & Relationships • Typically price retracement 50% - 78.6% of Wave 1. • Often Wave A = Wave C, or Wave C = 0.618 of Wave A • Trading Tactics • Quality long entry locations are below 50%, but above 78.6% retracement of Wave 1.
Wave Two Guidelines • Usually an A-B-C ZigZag formation • Extreme bearishness towards the end of wave 2 • Usually angled sharply against wave 1
2nd Wave Price Ratios • Wave 2 retracements • 38.2% – blue –minimum • 61.8% – green – ideal • 78.6% - orange – maximum • Wave A and C • 61.8% – blue – minimum • 100% - green – ideal • 161.8% – green - ideal • 200% - orange - maximum Motive Wave Tip Right mouse click on the Fib ratio and uncheck “lines”, and “range” to clean it up
Motive Wave Tip Right mouse click on the dotted line of the wave you would like to analyze, click “Time Analysis” 2ndWaves Time Ratios • Wave 2 vs 1 time relationship • 38.2% – blue – minimum • 61.8% - green – ideal • 161.8% - orange – maximum • A and C of wave 2 • 61.8% – blue – minimum • 100% - green – ideal • 161.8% - green – ideal • 200% - orange - maximum
Wave 2 Guidelines • Trading Tactics • Between the 38.%2 and 78.6% Fib PRICE retracements • Between the 38.2% and 161.8% Fib PRICE retracements • The intersection creates a zone • The zone can be bought with stops at 1 of 3 places
Specific Wave Guidelines 5 Wave 3 5 3 B 3 Wave 5 Wave A 4 1 Wave 4 Wave B Wave C 2 1 4 Wave 3 A Wave 2 C Wave 1 2
Wave Three Guidelines • Price Structure • Usually the strongest & longest, but never the shortest wave. • Should be able to identify 5 waves of smaller degree within • Wave 3, that meet all the rules of an impulse wave. • Ratios & Relationships • Once Wave 1 high is exceeded, minimum objective of Wave 3 is • 100% expansion of Wave 1 measured up from Wave 2 bottom. • Ideally, Wave 3 travels between 161.8 – 261.8% of Wave 1 • measured from Wave 2 bottom. • Trading Tactics • If not long from Wave 2, longs can be taken on break of • Wave 2 highs targeting 161.8 or 261.8% expansion of • Wave 1. Stops directly below Wave 2 low.
Wave Three Guidelines • Price Structure • Usually the strongest, but • never the shortest wave in • the sequence. • Should be able to identify 5 • waves of a smaller degree • within Wave 3, that meet all • the rules of an impulsive • wave.
Wave Three Guidelines • Price Ratios Relationships • Wave 3 vs. 1 • -100% - blue – minimum • -161.8% - green – ideal • -200% - orange - maximum • Time Ratios Relationships • Wave 3 vs. 1 • -61.8% - blue - minimum • -161.8% - green – ideal • -261.8% - orange - maximum
Wave Three Trade Tactics • Trading Tactics • Buy wave smaller degree wave 2 pullbacks. • Look for continuation signals in wave 3-of-3*
B A C Specific Wave Guidelines 5 Wave 4 B Wave 5 Wave A D Wave 4 Wave B Wave C E 1 4 Wave 3 A Wave 2 C Wave 1 2
Wave Four Guidelines • Price Structure • If wave 2 was a simple A-B-C, expect wave 4 to be shallow & complex. • Triangle or Flat Correction possible. Wave 4 must be at least 1 pip • below Wave 3 high. Complex corrections (W-X-Y) possible. • Ratios & Relationships • Typically retraces 23.6 – 50.0% of wave 1-3. Total time elapsed • in wave 4 should be at least 100% of elapsed time in wave 2. • Trading Tactics • Best to stay out of a Wave 4 as it typically is long and drawn • out. Only acceptable entry is upon completion of a single or • complex flat or triangle in Wave 4 for Wave 5 move to new • highs. Do not enter if Wave 4 has not retraced at least 38.2% • of Wave 3 unless Wave 4 corrective structure is clearly done.
Wave Four Guidelines • Price Structure • If wave 2 was simple A-B-C, • expect Wave 4 to be shallow • & complex. • Triangle, Flat or Complex • (W-X-Y) corrections possible • & likely. • Upon completion, Wave 4 • must be at least 1 pip below • Wave 3 high.
Wave Four Guidelines • Wave 4 vs. 3 • Price -Typically retraces a • minimum of 23.6% and • maximum of 50% of waves 3. • Time -Typically retraces a • minimum of 61.8% and • maximum of • 161.8 of waves 3.
Wave Four Guidelines • Wave 4 vs. 2 • Price –Wave 4 typically • minimum of 61.8% and • maximum of 161.8% compared to wave 2 • Time –Wave 4 typically • minimum of 61.8% and • maximum of 423.6% compared to wave 2
Wave Four Guidelines • Trading Tactics • Best to stay out of Wave 4 • as it typically long & drawn • out. • Only acceptable entry is upon • completion of a single or • complex flat or triangle in • Wave 4 for Wave 5 move to • new highs. Do not enter if • Wave 4 has not retraced at • least 38.2% of Wave 3 unless • Wave 4 corrective structure • is clearly finished.
Specific Wave Guidelines 5 5 3 B 3 Wave 5 Wave A 4 1 Wave 4 Wave B Wave C 2 1 4 Wave 3 A Wave 5 Wave 2 C Wave 1 2
Wave Five Guidelines • Price Structure • Final wave in sequence before corrective reversal begins, possibly • more. Can be either an impulse or an ending diagonal, but must • have 5 waves. Will usually show indicator divergence in Wave 5 • as compared to Wave 3. • Ratios & Relationships • Wave 5 completes at: • 200% - 261.8% expansion of Wave 1 up from Wave 2. • 38.2% - 61.8% expansion of Waves 1-3 up from Wave 4. • 127.2% - 161.8% external retracement of Wave 4. • 161.8 – 423.6% external retracement of Wave 2. • If Wave 3 was extended, expect Wave 5 to be equal in distance • to Wave 1. Very powerful relationship. If not, look for Wave 5 • to be 61.8% of Wave 1. Will often terminate in Fib clusters.
Wave Five Guidelines • Trading Tactics • Fading completed 5 wave sequences is vital to professional trader’s • arsenal. There will be overwhelming evidence to do so, but the risk • can be quite low. • Before fading a completed 5 wave sequence, go to 1 lesser • degree and identify another 5’th Wave of completion. • Stops go just above your 5th wave high. Take profits on majority of • your position after 3 wave correction.
Wave Five Guidelines • Price Structure • Final wave in sequence • before corrective reversal • begins, possibly more. • Can be either an impulse or • an ending diagonal, but • must have 5 waves. • Will usually show momentum • indicator divergence in • Wave 5 as compared to • Wave 3.
Wave Five Guidelines • Ratios & Relationships • Wave 5 completes at : • 200% - 261.8% expansion of • Wave 1 up from Wave 2. • 38.2% - 61.8% expansion of • Waves 1-3 up from Wave 4. • 127.2% - 161.8% external • retracement of Wave 4. • 161.8% - 423.6% external • retracement of Wave 2.
Wave Five Guidelines • Ratios & Relationships • If Wave 3 was extended, • expect Wave 5 to be equal • in distance to Wave 1. Very • powerful relationship. If • not, look for Wave 5 to • terminate at 61.8% of • Wave 1. • Will often terminate into • clusters of various fib • retracements.
Wave Five Guidelines • Trading Tactics • Fading completed 5 wave • sequence is vital to a traders • arsenal. • Before fading a completed • 5 wave sequence, go to one • lesser degree & identify • another 5-th wave • completion. • Stops go just above the 5th • Wave high. Take profits on • majority of your position • after a 3 wave correction.
Wave Five Guidelines • Daily Chart 4 Hour Chart
Specific Wave Guidelines 5 2 B 3 Wave 5 1 Wave A 4 Wave 4 Wave B Wave C 3 5 1 4 Wave 3 A Wave A Wave 2 C Wave 1 2
Wave A Guidelines • Price Structure • Can be either 3 or 5 smaller degree waves – usually 5. If just a quick • 3 waves down, consider it A of larger Flat. If 5 waves down, will • either be impulse or leading diagonal. Markets remain bullish. • Ratios & Relationships • Should retrace 38.2% - 50% of prior motive wave. • Trading Tactics • Just like Wave 1’s, be very selective trading. Too little is • known about the newly formed motive wave. If anything, • look to buy completion of smaller degree wave 5-of-A for a • 3 wave retracement in larger degree Wave B.
Wave A Guidelines • Price Structure • Can either be 3 or 5 smaller • degree waves, usually 5. If • just a quick 3 waves down, • consider it A of larger flat. • If 5 waves down, will either • be impulse or leading • diagonal. • Markets will remain • bullish following huge run • up.
Wave A Guidelines • Ratios & Relationships • Should retrace 38.2% - 50% • of prior motive wave. Need Graphic
Wave A Guidelines • Trading Tactics • Just like 1st waves, be very • selective trading. Too little • is known about this newly • formed motive wave. • Need graphic • If anything, look to buy • completion of smaller • degree wave 5-of-A for a • 3 wave retracement in • larger degree Wave B.
Specific Wave Guidelines 5 C B 3 A Wave 5 Wave A Wave 4 Wave B B Wave C 1 4 Wave 3 A Wave B Wave 2 C Wave 1 2
Wave B Guidelines • Price Structure • Usually 3 waves in A-B-C zigzag formation. Extreme bullishness as • Wave 5 highs are approached. If Wave A was 5 down, Wave 5 high • can NOT be exceeded. • Ratios & Relationships • Typically retraces between 50% - 78.6% of Wave A. • Trading Tactics • Quality short entry locations above 50%, but below 78.6% • retracement of Wave A. Stop losses directly above Wave A • beginning.
Wave B Guidelines • Price Structure • Usually 3 waves, an A-B-C • zigzag formation. • Extreme bullishness as • Wave 5 highs are • approached. Need Graphic • If Wave A was 5 waves • down, Wave 5 high can • NOT be exceeded.
Wave B Guidelines • Ratios & Relationships • Typically retraces between • 50% - 78.6% of Wave A. Need Graphic
Wave B Guidelines • Trading Tactics • Quality short entry locations • above 61.8%, but below • 78.6% retracement of • Wave A. • Stop losses placed directly • above Wave A lows. • Shown is bearish B wave • correction, therefore • reversing tactics.
Specific Wave Guidelines 5 B 3 2 Wave 5 Wave A Wave 4 Wave B 1 4 Wave C 1 4 Wave 3 A 3 5 Wave 2 C Wave 1 Wave C 2
Wave C Guidelines • Price Structure • Almost always a 5 wave structure. Triangle’s are the exception. • Extreme bearishness as Wave A lows are approached & often broken. • Ratios & Relationships • Wave C = prior Wave A, else Wave C = .618 of Wave A. • OR = 127.2% - 200% external retracement of Wave B. • Typically Wave C terminates between 50% - 78.6% retracement • of the prior motive wave of one larger degree. • Trading Tactics • Quality long entry locations are 100% - 161.8% expansion of • Wave A. Look for confluence from a retracement level of a • prior motive wave. Stop losses below low of motive wave of • one larger degree.
Wave C Guidelines • Price Structure • Almost always a 5 wave • structure. Triangles are • the exception. • Extreme bearishness as • Wave A lows are • approached, & often • broken. Need Graphic
Wave C Guidelines • Ratios & Relationships • Common Wave C relationships: • = prior Wave A, else C = .618 • of Wave A. • = 127.2% - 200% external retracement • of Wave B. Commonly • terminates between • 50% - 78.6%retracement of • prior motive wave of one • larger degree. Need Graphic
Wave C Guidelines • Trading Tactics • Quality long entry locations • at 100% - 161.8% expansion • of Wave A. • Look for a confluence from a • retracement level of a prior • motive wave. Need Graphic • Stop losses placed directly • below the low of the motive • wave of one larger degree.
Specific Wave Guidelines 5 B 3 Wave 5 Wave A Wave 4 Wave B Wave C 1 4 Wave 3 A Wave 2 C Wave 1 2