Download
1 / 24
240 likes | 415 Views
Inland Waterways Freight Transportation and American Commercial Lines. October 2010. The Inland Waterways Transportation Industry The solution for relieving congestion on our nation’s highways and railways The cleanest, safest, most fuel efficient and most economical mode of

E N D
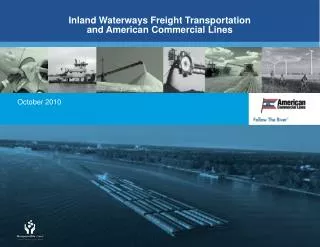
Inland Waterways Freight Transportation and American Commercial Lines October 2010
The Inland Waterways Transportation Industry • The solution for relieving congestion on our nation’s highways and railways • The cleanest, safest, most fuel efficient and most economical mode of freight transportation Michael P. Ryan, President and CEO 2
Inland Waterways Transportation The Inland Waterways Transportation Industry is an integral part of our nation’s economy, moving raw materials and cargo to our cities, industries and regions of agricultural production. Key Commodities Moving on the Inland Waterways* Other 4% Metals & Ores 5% Chemicals & Petroleum 29% Minerals & Stone 19% Grain & Agricultural Products 13% Coal 32% 566.9 Million Tons Annually Source: March 2010 Informa Economics Barge Commodity Profile
One Sixth of U.S. Tonnage Moves by Water $780 Billion Transportation Market 3.76 Trillion Domestic Ton Miles Air 3.2% Rail Intermodal 1.5% Pipeline 4.6% WATER 1.4% Air .4% Railroad 5.6% WATER 16.5% Truck 28% Truck 28% Pipeline 15.3% Truck 83.8% Railroad 39.8% Source: American Trucking Association; U.S. Bureau of Transportation Statistics Source: Center for Ports & Waterways, Texas Transportation Institute, U.S. Army Corps of Engineers
Inland Waterways Transportation Contributes Significantly to the Nation’s Economy. • Contributes more than $5 billion to the U.S. economy annually • Employs over 500,000 U.S. workers in the industries supplied by inland waterways transportation • Transports • 20 percent of the nation’s coal for electricity generation • 60 percent of the all U.S. grain exports • Approximately 22 percent of domestic petroleum products • Directly serves over 87 percent of major U.S. cities Source: Texas Transportation Institute – 2008 National Waterways Foundation
Inland Waterways System The U.S. Inland Waterways -nearly 12,000 Miles of waterways and 240 Lock Sites Connecting 38 StatesOver 90 Million People Live within 100 Miles of the Mississippi River, Ohio River, and Gulf Intracoastal Waterways.
Each Year, 624 Million Tons of Cargo Are Transported on the Inland Waterways. Industry Traffic Flows Dry Cargo • Coal • Grain • Steel Products • Bulk Ores • Cement • Road Salt • Fertilizer • Alumina • Project Cargoes • Intermodal Containers • Liquid Cargo • Chemicals • - Styrene • Petroleum Products • - Lube Oil • - Gasoline • - Diesel and Jet Fuels • Agricultural Products • - Ethanol • - Soybean Oil • - Liquid Fertilizers Imports Coal Grain Coal & Sand Steel & Scrap Imports Stone Coal Chemicals
One Barge Tow Carries the Loads of Hundreds of Railcars or over a Thousand Trucks.
Barges Are the Most Efficient Mode of Transportation. Barge transportation is the most energy-efficient choice. Barges can move one ton of cargo 576 miles per gallon of fuel – that’s 163 miles further than railcars and 421 miles further than trucks. 576 413 155 Ton-miles Traveled per Gallon of Fuel Source: Texas Transportation Institute – 2008 National Waterways Foundation
Barges Are the Cleanest Mode of Transportation. Barge transportation generates fewer emissions than railroads or trucks per ton-mile in the four standards tracked by the EPA: • Carbon monoxide (CO) • Nitrogen oxides (NOx) • Particulate matter (PM) • Hydrocarbons (HC) PM 0.011164 HC 0.01737 CO 0.04621 NOx 0.46907 PM 0.01621 HC 0.02423 CO 0.06445 NOx 0.65423 PM 0.018 HC 0.020 CO 0.136 NOx 0.732 Grams per Ton-miles Source: Texas Transportation Institute – 2008 National Waterways Foundation
Barges Are the Safest Mode of Transportation. Barge transportation has significantly fewer fatalities, injuries and spills than railroads or trucks. Spills of More Than1000 Gallons Injuries Fatalities 1 22.7 155 1 125 2,171 3.60 3.86 6.06 Rate of Spills inGallons per Million Ton-miles Source: Texas Transportation Institute – 2008 National Waterways Foundation
A Congested U.S. Transportation System • An estimated 10,500 trucks per day per mile on the interstate highway system, projected to more than double by 2035 • Estimated $200 billion in costs each year • Approximately 4.2 billion hours in traffic each year • About 2.9 billion gallons of fuel each year U.S. Department of Transportation, Maritime Administration (http://www.marad.dot.gov/ships_shipping_landing_page/mhi_home/mhi_home.htm), July 2009 Federal Highway Administration Report: Estimated Cost of Freight Involved in Highway Bottlenecks – Final Report, November 2008
TheFuture of the Nation’s Infrastructure • The Transportation Research Board projects a 70 percent increase in the nation’s output of goods and services by 2020 • Truck traffic is estimated to increase by 67 percent • The estimated annual cost to maintain current highways and bridges from 2005 to 2024 is $80 billion • Rail traffic is estimated to increase by 88 percent over the next 30 years • Railroads will need to spend $148 billion over the next 28 years, according to the Association of American Railroads • $8 to $9 billion will be needed for the nation’s transportation infrastructure over the next 30 years, according to the Corps of Engineers Transportation Research Board: Freight Capacity for the 21st Century American Association of State Highway and Transportation Officials: Freight-Rail Bottom Line Report AAR/Cambridge Systematics Inc. September 2007
Inland Waterways Arethe Transportation Solution of the Future. • Barges on the inland waterways carry the equivalent of 58 million truck trips per year with capacity to spare • The U.S. inland waterways system is estimated to have 60 percent available capacity • If waterborne cargo was diverted to the highways or the railroads, • Truck traffic would double on the interstates • Railroad tonnage would increase 25 percent Source: Texas Transportation Institute – 2008 National Waterways Foundation
American Commercial Lines – A Leader in the Inland Waterways Transportation Industry • The solution for relieving congestion on our nation’s highways and railways • The cleanest, safest, most fuel efficient and most economical mode of freight transportation Michael P. Ryan, President and CEO 15
American Commercial Lines - Operating on the Inland Waterwaysfor Nearly 100 Years 2009 ACL moved approximately 32.2 million dry cargo ton miles and 1.8 million liquid ton miles, earned approximately $850 million in revenue and employed over 2,500 people. 1915 Patrick Calhoun, formed the Beattyville Co. to haul Kentucky coal by river barge 1938 Acquired the Sweeney Shipyard in Jeffersonville, IN and renamed it the Jeffersonville Boat and Machine Co. 1915 2010 1939 - 1945 The company grew as barge building and shipping boomed during World War II. The Howard Shipyard was purchased by the U.S. Navy and combined with neighboring Jeffersonville Boat and Machine Co. to employ 13,000 people in the production of vessels for the war effort. 2010 ACL is the second largest liquid cargo barge line and the third largest dry cargo barge line in the country and leads the industry in safety performance 1927 Merged with the West Virginia-based W.C. Kelly Barge Line Co. to form American Barge Line Company (ABL)
American Commercial Lines – A Leading Marine Transportation Company • Headquartered in Jeffersonville, IN, located on the Ohio River • Northern Division Headquarters in Cairo, IL • Southern Division Headquarters in Harahan, LA • Operating since 1915 on the U.S. inland waterways • Approximately $850 MM in revenues in 2009 • Approximately 2,570 employees • A fleet of more than 2,500 barges powered by approximately 123 towboats • Our Mission: Deliver premium transportation services and solutions to meet the evolving needs of our customers • Core Values: Safety, Customer Focus, Innovation, Integrity, Value Northern Division Southern Division Core Network
Jeffboat – ACL’s Manufacturing Division • The largest inland shipyard in the U.S. • A leader in marine design and construction • Lean manufacturing initiatives drive efficiency and productivity • The second largest manufacturer of dry cargo and liquid tank barges in the U.S.* • Industry leader in safety • Awarded the 2009 University of Louisville Labor-Management Center’s 16th Annual Labor-Management Award Source: Criton industry data as of 2008
ACL, the Industry Leader in Safety is Driving Accidents/Injuries to Zero with Zero Tolerance for Unsafe Behavior
ACL’s Revenue Portfolio Mix 2009 Full Year 2008 Full Year Services 6% Services 7% Coal 11% Coal 12% Liquid 27% Liquid 29% Transportation Bulk 25% Grain 21% Bulk 31% Grain 31% December 31, 2009 December 31, 2008 Legacy $37 17% Manufacturing Sales Backlog (in millions) Non-Legacy $175 83% Non-Legacy $49 100% Total Backlog - $49 Total Backlog - $212
Inland Waterways Transportation Industry Liquid Carriers Dry Carriers Total Dry Barges Number % of Total Ingram Barge Co. 3,728 20.7% AEP Memco LLC 2,978 16.5% ACL 2,254 12.5% American River Transport 2,034 11.3% Crounse Corporation 948 5.2% All Other Carriers 6,072 33.7% Total 18,014 Total Liquid Barges Number % of Total Kirby Corp. 914 30.5% ACL 392 13.1% Canal Barge Co., Inc. 206 6.9% Marathon Petroleum Co. 183 6.1% Ingram Barge Co. 164 5.5% All Other Carriers 1,132 37.8% Total 2,991 Source: March 2009 Informa Economics Barge Fleet Profile
ACL Develops Premium Transportation Solutions for Our Customers
ACL Value Proposition • Customer focused • The most economical, safest, and most environmentally friendly transportation solutions • Industry leader in safety performance • Industrial development services, replicating the model of the railroads • Strategic partnerships provide multi-modal and storage solutions • Recognized for safety and environmental performance • American Chemistry Council’s Responsible Care Partnership Program • Certified by American Waterways Operators’ Responsible Carrier Program • Indiana Department of Environmental Management Governor’s Award • The William M. Benkert Marine Environmental Protection Award • Advocate member of Kentucky’s EXCEL program • Member of Indiana Partners for Pollution Prevention • Presented the 2010 GE Energy New Product Introduction Award for the most innovative solution • to GE Energy’s commercial transportation supply chain • Received Service Excellence Award from Compass Minerals
Contact: David Parker, Vice President Investor Relations & Corporate Communications 812.288.1765 ~ david.parker@aclines.com American Commercial Lines 1701 E. Market St. Jeffersonville, IN 47130 www.aclines.com Michael P. Ryan, President and CEO 24