Download
1 / 42
420 likes | 500 Views
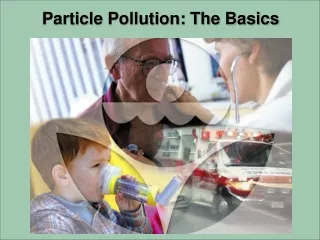
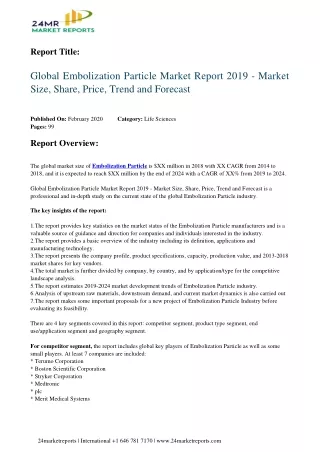
Explore the changing trends and major components of PM2.5 in the Eastern US from 1999-2003, examining sites, data sources, and composition changes. Understand sulfates, nitrates, carbon, and more.

E N D
Materials to Support Particle Pollution Report, 2004 February 28, 2005
Regional Trends in PM2.5in the Eastern US For EPA Trends web page to support the EPA Particle Pollution Report (“The details behind Figure 16”)
18 16 IMW Annual Average PM2.5 concentration, ug/m3 14 NE SE 12 10 1999 2000 2001 2002 2003 year Understanding PM2.5 Regional Trends • Annual average PM2.5 concentrations have different trends among Eastern US Regions, 1999-2003 • What locations are reflected in each composite Regional trend? • What chemical components typically make up PM2.5 in Eastern US? • What are data sources for the major components? • How did PM2.5 urban and rural composition change since 1999? +1% (+0.2 ug/m3) -20% (-3.1 ug/m3)
The 290 PM2.5 sites included in this Regional Trend Analysis Number of Trend sites 56 119 • Three eastern regions studied because they contain most high PM2.5 concentration locations • 762 Eastern PM2.5 sites had monitoring data in at least one year since 1999 • 290 PM2.5 “trend” sites (with 5 complete years of data) • Some sub-areas are not represented. • E.g. The NE region does not include up state NY, and mostly covers the Washington-Boston Corridor • IMW has few sites in IN • Southeast does not include AR, OK and SE Texas. • Sites are clustered around metropolitan areas in some States (e.g. Chicago/Milwaukee; Pittsburgh; St.Louis) 56 119 115 115 290 PM2.5 trend sites Other PM2.5 sites
Sulfates, Carbon and Nitrates are the major components of PM2.5 in the Eastern U.S. • Ambient PM2.5 in the Eastern US is mostly comprised of sulfates and carbonaceous mass • Nitrate is also a large component of PM2.5 in the NE and IMW • These are the 3 most important chemical component trends to understand Source:The Particle Pollution Report: Current Understanding of Air Quality and Emissions through 2003 (Figure 2)
Data sources for PM2.5 components5 years of sulfates and nitrates with good regional coverage from rural networks. More limited coverage for carbon and for urban measurements • Monitoring networks with Eastern US PM2.5 composition data • STN/SLAMS • Urban oriented, many urban areas represented (54 STN and ~150 supplemental sites) • Provides all major components (SO4, NO3, OC, EC, crustal) • Measurements were only available for 2002 and 2003. • IMPROVE http://vista.cira.colostate.edu/improve/ • Remote locations with focus on characterizing National Parks and Wilderness (Class I) areas . • All major components (SO4, NO3, OC, EC, crustal), • Limited number of sites with 5 years of data (x sites in 99, y sites in 02,) • Coverage varies by State and region • CASTNET http://www.epa.gov/castnet/ • Rural locations • Great spatial coverage for Eastern US, particularly down wind of power plants. • Can provide SO4 and NO3 concentrations, but its nitrates may not be comparable to other speciation network data (teflon filter, no denuder, no size separator) • Measurements are weekly averages which provide more complete annual coverage • SEARCH http://www.atmospheric-research.com/ • Urban and rural concentrations in the southeastern US • Provides PM2.5 and major constituents measurements for 1999-2003
Rural speciation data can help understand urban composition and trends • Based on the urban increment analysis, rural network data can provide urban indicators for • sulfates (most is the regional component) • nitrates (more than half is regional) • Carbon will be discussed later Source:The Particle Pollution Report: Current Understanding of Air Quality and Emissions through 2003 (Figure 6)
IMPROVE Network has limited number of Eastern trend sites, 1999-03 IMPROVE network only had ~14 eastern Sites in 1999. There were 22 by 2002. Estimated region with highest sulfates greately widend with the inclusion of additional monitoring locations. Therefore trends based on evolving IMPROVE network data could be uncertain. (Estimated spatial patterns for ammonium sulfate are shown) 1999 2002 From VIEWS http://vista.cira.colostate.edu/views/
CASTNET provide great spatial coverage for Eastern US, 1999-2003There are over 50 CASTNET sites in the Eastern US(51 in 1999, 54 in 2003) CASTNET network provides weekly average measurements of sulfate and nitrate concentrations
Although CASTNET and IMPROVE provide different indicator measurements of sulfates and nitrates (explanation),CASTNET and IMPROVE display similar trends • 11 collocated sites are used to compare quarterly average sulfate and nitrate concentrations, 2001-2003 ((See Next 2 Slides) • Sulfates • CASTNET sulfates are very comparable to IMPROVE sulfates. • provide good estimates for the “regional” concentrations • Nitrates • Quarterly average nitrates are highly correlated and display similar trends • CASTNET nitrates are lower at some sites, presumably due to loss of volatile nitrates • Everglades FL CASTNET was considerably higher than IMPROVE, likely due to coarse particle nitrates. This site was excluded from the analysis.
Quarterly averages, 2001-2003 Quarterly averages, 2001-2003 1:1 line 6 sites, IMW CASTNET vs IMPROVE Sulfates 4 sites, NE 1 site, SE
Quarterly averages, 2001-2003 Quarterly averages, 2001-2003 1:1 line SHENAN VA QUAKER OH BONDVI IL CADIZ KY MK GOD PA VOYAGR MN 1:1 line CASTNET vs IMPROVE Nitrates ACADIA ME CONNHL MY LYBROK VT ARENDS PA CASTNET nitrate is lower, but not significantly lower, Why? 'GRSMMT TN'; Trends are similar, but CASTNET may be lower 1:1 line
16 14 Predicted values in vicinity of 6 CASTNET sites: SHENAN VA VPI VA CKT KY MCK KY CDR WV PAR WV 12 10 CASTNET Amm nitrate 8 6 4 2 0 1999 2000 2001 2002 2003 CASTNET and IMPROVE sites show similar ammonium nitrate trends,1999-2003 Higher CASTNET concentrations may reflect the less remote nature of some locations 3 IMW IMPROVE sites
Adjustments to CASTNET measurements to reflect urban FRM composition in Eastern US • CASTNET SO4 and NO3 quarterly average concentrations are spatially interpolated and values are predicted at FRM locations • This accounts for different spatial distribution of PM2.5 FRM sites and CASTNET sites • Spatial analysis performed by fitting a spatial trend and estimating the best spatial covariance for each calendar quarter * See: http://www.epa.gov/air/interstateairquality/pdfs/Revised-SMAT.pdf
Kriging to estimate nitrates and sulfates at FRM trend site locations • CASTNET and FRM networks have different spatial coverage and distribution throughout the Eastern US • the FRM sites are clustered (e.g. around population centers sites starting in 1999) • CASTNET sites are more uniformly distributed, are in areas without many FRM sites and are not located in all States • CASTNET concentrations are therefore kriged and estimated at FRM locations • CASTNET measurements must also beadjusted to reflect FRM chemical composition CASTNET Sites 290 PM2.5 trend sites
Adjustments to CASTNET measurements to reflect urban FRM composition in Eastern US (continued) • Sulfate Adjustments • Include NH4 mass: assume 50/50 bisulfate-sulfate • Add particle bound water, as used for proposed CAIR * • No other adjustments are made to CASTNET sulfates to reflect urban concentrations for this analysis
Effect of Spatial Interpolation on Regional Ammoniated Sulfates Average Sulfate estimated at FRM sites are higher than the CASTNET site average for the NE Network average ESPN sulfates are also shown (squares) CASTNET network average sulfate Sulfate predicted at FRM locations CASTNET sites are distributed uniformly throughout the NE region and reflect more lower sulfate locations than the FRM trend sites. IMW NE SE
Increased sulfate mass due to water Comparisons of Regional average hydrated ammoniated sulfates Sulfate mass is approximately 25% higher Hydrated sulfate at FRM locations FRM location (dry sulfate) IMW NE SE
Adjustments to CASTNET measurements to reflect urban FRM composition in Eastern US (continued) • Nitrate adjustments • Include NH4 mass: assume 100% ammonium nitrate • Reflect lost nitrates due to volatile particles* not captured on FRM filters • Add particle bound water, as used in SMAT for CAIR • Nitrate portion is nominally 10% of estimated ammonium nitrate mass • Nitrate water is 15-25% of total pbw • Apply regional adjustment to • Reflect higher concentrations in urban areas • Use average nitrate at urban speciation sites during 2002-03. * Based on relationships developed using 2002 urban nitrates See: http://www.epa.gov/air/interstateairquality/pdfs/Revised-SMAT.pdf
Rural nitrate predicted at FRM sites is higher than Regional CASTNET site average Rural predicted at FRM sites CASTNET site avg. IMW NE SE
STN measurements and Estimates for Retained NO3 are used to calibrate NO3 trend To reflect FRM NO3 levels STN Rural predicted at FRM sites Reduction due to loss of volatile nitates Est. FRM nitrate Adj.STN IMW NE SE
Adjustments to Species data (continued)To make species data FRM-like for Eastern US • Include a small mass associated with urban crustal matter • Derived from STN sites, average concentration 2002-03, • (Only 2 years of STN data are available) • Assigned to all 5 years, 1999-2003 • PM2.5 remainder is then calculated • Remainder = PM2.5- [sulfate+nitrate+ammonium+water+crustal] • What does the remainder include: • Average total carbonaceous mass • Year-to-year variations in • crustal matter • Urban increment for nitrates • Changes in estimated FRM-like nitrates • Because carbon is such a large component of PM2.5 compared to the other constituents, the remainder is assumed to be mostly carbon
PM2.5, sulfate, nitrate and “remainder” trends SE IMW NE PM2.5 PM2.5 PM2.5 Hydrated sulfate Hydrated sulfate Hydrated sulfate PM2.5 remainder (mostly carbon) PM2.5 remainder (mostly carbon) PM2.5 remainder (mostly carbon) Estimated nitrate Estimated nitrate Estimated nitrate 5-yr avg crustal 5-yr avg crustal 5-yr avg crustal
PM2.5 Remainder Caveats • Because of adjustments for nitrates, sulfates and crustal in this analysis, the “PM2.5 remainder” does not reflect changes in: • the urban increments for sulfates or nitrates • adjustment between measured and estimated FRM nitrates (say due to year-to-year variations in temperature) • urban crustal concentrations • Any changes in operation of FRM network • All of the above are assumed to be small relative to carbonaceous mass
Corroboration that PM2.5 remainder is mostly carbon • Comparison to Total Carbonaceous Mass (TCM) from STN speciation samplers for 2002-03 • STN carbon estimated as 1.4OC+EC • SEARCH OC, EC trends, 1999-2003 • IMPROVE trends, site specific (derived from VIEWS), 1999-2002 (to be updated when available)
1. PM2.5 Remainder is comparable to ESPN network avg concentrations, 2002-03 (ESPN carbon is defined using OCM multipliers of 1.4 and 1.8) SE IMW NE PM2.5 remainder trend line ESPN network avg carbon Based on multipliers of 1.4-1.8
2. Urban and rural SEARCH carbonaceous mass declined 15-21% at urban locations, 27-34% at rural locations -21% -15% -27% -34% There is a 2-3ug/m3 decline in urban carbon and a smaller decline in the regional (rural) component
3. IMPROVE sites show declines in organic carbon in IMW and SE. Small increase in NE at several sites.(Note: 2002 data were influenced by Quebec fire) Percent changes among IMPROVE sites 1999-2003
Differences between CASTNET and IMPROVE nitrate measurements • IMPROVE • 24-hr measurements, once every 3 days • PM2.5 size separated particles • Particle nitrates collected on nylon filter after denuder to remove nitric acid • CASTNET • Integrated 7-day sample • The annual average reflects 365 days • Inlet does not remove coarse particles or nitric acid • Nitrates collected on teflon filter followed by nylon filter • Any volatile nitrates are collected on nylon filter and reported together with collected nitric acid Return to Presentation
Why is there little difference between CASTNET and IMPROVE nitrate?And why FRM nitrates can be much lower • Unlike FRM samplers with anodized aluminum inlets, CASTNET samplers does not remove nitric acid. • With ambient nitric acid in the sampler airstream, there is less potential for volatilization • Limited NH3 can also cause lower particle nitrates and may explain regional differences • Coastal sites in the east with high concentrations of coarse particle nitrate (e.g. Everglades,FL) result in CASTNET nitrates > IMPROVE nitrates Return to presentation
Long-Term IMPROVE Trends in the Eastern United States In Support of Particle Pollution Report, 2004
IMPROVE Data • Trends shown for all sites that met completeness criteria for years 1993-2003. • Major components of PM2.5 shown: ammonium sulfate, ammonium nitrate, total carbonaceous mass, and crustal material. Ammonium nitrate only shown for 1999-2003 due to some issues with earlier measured values of nitrates. • Trends shown by three different sub-regions in the Eastern United States: the Northeast, Southeast, and Industrial Midwest
Alternative way to show data in Figures 7 and 8 • County based maps of 2003 PM2.5 and PM10 status shown. Data exactly same as that used in site-based 2003 status maps shown in Particle Pollution Report.