Download
1 / 17
170 likes | 256 Views
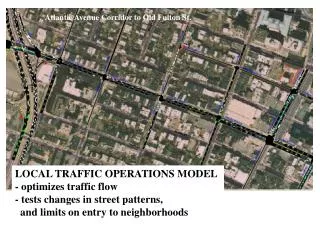
This project aims to develop a traffic operations model supporting the Central Phoenix Transportation Framework Study within Maricopa Association of Governments. It involves simulation modeling and staff training to enhance analysis tools.

E N D
Early Report on the Central Phoenix Inner Loop Traffic Operations Model Phase I Daniel Morgan, Caliper Corporation Micah Henry, Maricopa Association of Governments
Objective Add simulation modeling based on modern traffic modeling software and methods to Maricopa Association of Government’s (MAG) suite of analysis tools Develop a traffic operations model that will support the Central Phoenix Transportation Framework Study (CPHX) Train staff to use the model
Scope Focus on the Central Phoenix portion of the MAG region (i.e., that area covered by the CPHX) Study area bounded by Loop 101 on the north, east, and west, and the Gila River Indian Community/Loop 202 on the south Inclusion of all vehicular modes (Auto, Truck, Bus, Rail)
Geography • 530 square miles of Central Phoenix and parts of Glendale, Peoria, Scottsdale, Tempe, Chandler • Including freeway facilities under the purview of the Arizona Department of Transportation (AZDOT) • Including public transportation services provided by Valley Metro members: • City of Phoenix • Regional Public Transportation Authority (RPTA) • METRO (Light Rail)
Scale • 2,470 Miles (320 Freeway/2,150 Surface) • Approx. 5,690 in the planning network • Plus 20 miles of light rail • 23,400 Links/17,250 Nodes • 884 Origins and Destinations • 794 TAZ Centroids/90 boundary nodes • 7,800 Lane-miles (1,300 Freeway/6,500 Surface) • 1,700 Signalized Intersections
Status • Study Design (92%) • Draft a Study Design Document • Simulation Model Data Preparation (90%) • Prepare Simulation Model Inputs • Model Framework Development & Testing (15%) • Produce a Validated Simulation Model • Staff Training (1%) • Output: Project Manual, Training Classes • Schedule • Model to be completed by the end of 2011
Study Design A microscopic multimodal traffic simulation model in TransModeler An integrated TransModeler-TransCAD modeling framework A dynamic approach to traffic demand estimation A simulation-based dynamic traffic assignment approach to modeling route choice A 2D and 3D GIS model for project evaluation and visualization
Model Data Preparation • Road Network • Geography, lane-level geometry, centroids, centroid connectors • Traffic Demand Data • Freeway continuous count detectors, arterial midblock counts, arterial turning movement counts • Traffic Control Data • Signal timing plans, time-of-day, actuated detector locations • Public Transportation • Routes, stops, schedules
Model Framework • Dynamic O-D estimation • Simulation-based DTA • TransModelermicrosimulation-based DTA • Hybrid (or multi-resolution) simulation-based DTA • Companion DTA TransDNA that runs on the MAG planning network
Study Design Test of Concept 80 square miles (15%) 634 miles (27%) 447 signalized intersections (26%)
Performance * Based on an Intel Core i7 processor with 6 cores hyper- threaded (12 virtual cores) and 24 GB RAM • Target Peak Periods • AM: 6:00 – 9:00 AM, Approx. 1.4 million trips • PM: 3:00 – 6:00 PM, Approx. 2 million trips • AM Model Run Times for Study Design Test* • 3:00 – 9:00 AM, 545,900 trips • 56.5 minutes per simulation • 13.6 minutes to re-compute route choices • All told, 50 iterations completed in 72 hours
Next Steps • Complete model data preparation • Develop bus routes and stops • Complete review and refinement of signal timings outside the study design area • Calibration and Validation • Extend the O-D estimation and DTA to the entire study area • Performance Enhancements • Evaluate and catalog the properties of micro and meso simulation methods • Explore distributed computing, other speed-ups
Future • Deliver model • Train MAG staff to use the model • Phase II • Gather new data • Refine calibration/validation • Project demonstration/application