Download
1 / 38
380 likes | 444 Views
Indian Power Sector. 2014. 183 fold increase. 1950. 2014. 235 fold increase. 1950. Power Plant capacity - 2,49,488 MW. Electricity generation - 959 BU. Transmission lines - 2,86,500 ckm. Increase in Voltage Level. Energy Resource Map.

E N D
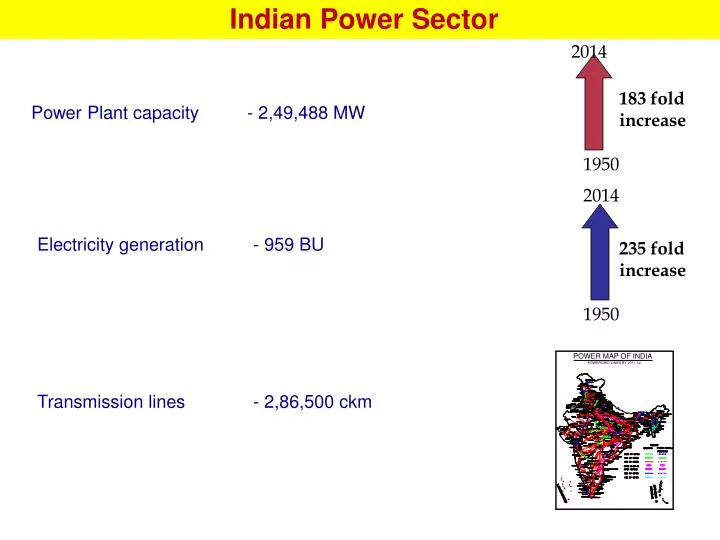
Indian Power Sector 2014 183 fold increase 1950 2014 235 fold increase 1950 Power Plant capacity - 2,49,488 MW Electricity generation - 959 BU Transmission lines - 2,86,500 ckm
Energy Resource Map • Generation resources located in few pockets • Hydro potential in NER and upper part of NR • Coal reserves mainly in Central India • Large coast line – imported coal based projects (AP, TN & Gujarat) • Transmission of power is economical • Renewables (solar, wind etc.) like hydro resources can not be transported Necessitate establishment of large nos. long distance lines
Transmission Domain in Indian Context Transmission – A Vital link between Generation and Load Inter-State Transmission System Intra-State Transmission System POWERGRID State Transco Private Transmission Licensee Private Licensee • Present Transmission Network • POWERGRID -1,08,000 ckm; STUs Network -1,70,000 ckm; Private/JV-8,500 ckm 4
POWERGRID Overview World Class, Integrated, Global Transmission Company With Dominant Leadership in Emerging Power Markets Ensuring Reliability, Safety and Economy Vision (*)- Based on 30.06.14 Closing Price of 139.20 on NSE
POWERGRID – Central Transmission Utility • Role as CTU • To undertake transmission of electricity through inter-State Trans. System (ISTS) • To discharge all functions of planning and coordination relating to ISTS • To ensure development of an efficient, co-ordinated and economical system of ISTS lines for smooth flow of electricity from Generating Stations to the load centres • To provide non-discriminatory open access to its transmission system
Transmission Addition CAGR : 9.05 % Ckm
National Grid - Evolution August 2006 North synchronized with Central Grid Existing I-R Capacity 38,550MW One Nation One Grid One Frequency March 2003 West synchronized With East & North-East NEW* Grid Dec’2013 South synchronized with NEW Grid South Grid October 1991 East & North-East synchronized Central Grid NE N E W S Five Regional Grids Five Frequencies
Transmission Growth National Grid – Present and Envisaged Planned IR Capacity: 68,050 MW 6000MW HVDC 2500 MW HVDC Inter-Regional Trans. Capacity (MW)
Transmission System – As of Today • Strong back bone of 400 kV – Overlay of 765 kV & high capacity HVDC under Implementation • All India synchronous grid – One of the largest in the World • Under new concept of planning, 10 nos. of high capacity corridors evolved - to reduce the dependency on a particular generation • These corridors shall facilitate about 40,000MW power transfer • No congestion in LTA, Congestion only in STOA & MTOA : Total congestion in 2013-14, about 5.6 BU (0.6%) as against annual generation of about 950 BU
Transmission Planning - Consideration • It is directional and to be known in advance. • System to be planned for peak power transfer • (N-1-1/G-1-1) reliability criteria • Conservation of Right of Way • To fit into long term perspective • The transmission system should have enough ‘controllability’ features (in addition to wires)
Change in Paradigm Now • De-licensed/Uncertainty in generation • Connectivity to Generators without PPA/Direction • Open access across the nation • Long term Access on Target Region • Economic despatch of generation Earlier • Generation is licensed • Regional self sufficiency with limited inter-regional allocation • Predictable Transmission
Challenges 1. Co-ordinated development of Transmission and Generation • Uncertainty in generation • Delay in implementation, change in destination, Fuel Shortage, Cost/Economic Despatch of Generation • Delay in transmission capacity addition (RoW, Forest) in some corridors may require longer gestation period. • Severe RoW in Kerala, Karnataka, Western UP, West Bengal & Sikkim • Delay due to regulatory issues for tariff based transmission projects • Suitable provision needs to be made to take undertake transmission projects under long litigations. 2. Matching development of intra-state transmission & distribution • State transmission system not keeping pace to meet growing power demand • Even though high capacity corridors are being constructed on target allocation basis, down below network to be developed by states matching with PPA
Challenges 3. Integration of renewable energy resources • Low gestation period of renewable generation than transmission • Grid Stability and Security 4. Skewed power flow due to market forces • CLP Jhajjar (1320MW), Aravali, Jhajjar(1500MW), Kayankulam in Kerala, Gas projects etc. planned as load centre based generation from stability point of view. On price consideration, they are not in operation putting extra burden on transmission. 5. Secured operation of large grid • Large Frequency Excursion • Wide variation of system parameters • Multiple tripping due to protection failure 6. Appropriate institutional and regulatory mechanism at state level • Generation, Transmission and Distribution at State level is under same holding company • Conflict of interest prevents prudent actions towards safe and reliable grid operation
Solution 1. Co-ordinated development of Transmission and Generation : Transmission to lead Generation • Long term Demand-Supply profile projection of each state for all time horizon (generation addition in the state, load, requirement of import / export) • Pre-defined Pocket-wise generation development plan to be firmed up for each plan with focused development • Long term perspective plan (say 15 - 20 years) needs to be developed. • Transmission needs to start on the basis of above plan without waiting for generation to materialize. This will also address issue on integration of RES. 2. Matching development of intra-state transmission and distribution • Intra-state transmission and distribution need to be planned beforehand at least 5-7 years in advance for each state according to load profile projection alongwith planned inter-state transmission as well as capacity addition • Innovative financing and institutional arrangement for implementation of intra-state transmission and distribution
Solution ….contd.. 3. Secured operation of large grid • Implementation of Primary and Secondary response • Protection along with augmentation and upgradation. • Ancilliary services • Reliability Standards • Compliance to Grid Code and Standards 4. Skewed power flow due to market forces • Commercial mechanism for optimal generation from load centric generators (grid stability point of view) • DISCOMs commercial viability • Suitable tariff mechanism along with security of payment: Need to be evolved like General Network Access so as to assure development and payment to the transmission licensee. • Appropriate institutional and regulatory mechanism • Strong regulatory measures at central/state level to ensure commercial viability and discipline. • Institutional development of STUs and proactive role of SERCs. • STUs /SLDCs need to be ring fenced from generation and distribution.
Evolving Voltage Landscape Bishwanath Chariali Bishwanath Chariali Delhi Delhi Agra Agra Jaipur Jaipur Gwalior Gwalior Ahmadabad Ahmadabad Mumbai Mumbai Hyderabad Hyderabad Chennai Chennai Bangalore Bangalore Thiruvananthapuram Thiruvananthapuram
Uncertainty in Generation • Slippage in NR, SR, ER & NER changed the load flow requirement. • ER & NER not in position to export to NR which was planned. • SR became importing region due to non-commissioning of projects (Actually with Krishnapatnam UMPP, it envisaged to export)
Uncertain Destination • In the absence of PPA, transmission schemes planned on the basis of target destination regions given by IPPs • For example in Chhattisgarh :- • LTA given to IPPs : 16,300MW • Proposed destination region : • Western Region :10,900 MW • Northern Region: 5,200 MW • Southern Region: 200 MW • Now on commissioning, most of the IPPs proposing to transfer power to SR
Proposal by IPPs in Uncoordinated Manner • Against plan of 15,993 MW under IPPs, 65,093 MW proposed by IPPs to add in XI Plan • State IPPs like Tiroda(3300 MW), Ideal Energy(270 MW) came up without adequate State tr. System; burdened ISTS • Above mislead the transmission plan.
NR NER SR Uncoordinated Generation Addition • Inter-regional flow depends on demand and generation addition • Any mismatch causes skewed power flows Heavy power rush on WR-NR corridor ER WR Generation delay of about 14,000 MW Generation addition of about 14,000 MW in last 2 years Generation delay of about 10,000 MW
Uncoordinated Generation Development • ER & NER • Delay in Generation Addition : 14,000 MW in ER & 4,000 MW in NER • SR • Delay of 10,000 MW generation addition resulting in deficit • Lines planned for export being used for import • Chhattisgarh (WR) • Large quantum for transfer through LTA in WR about 16000 MW in last 2 years • Earlier Target beneficiaries : WR-11000MW, NR-5000MW, SR-200MW only • Now destinations shifted to SR • Many State generations already commissioned (like Tiroda, IEPL etc. ) now seeking inter-State transfer • Non-Signing of Long term PPAs • Only about 8400 MW (i.e. 20%) of about 45000 MW ISGS capacity to be added by IPPs is tied up in long term PPA • Merchant power should be limited to about 15-20%
Long term PPAs • Long term PPA not materialising • About 2600 MW (12%) from IPPs Projects commissioned in 12th plan and 5800 MW (27%) from IPP projects to be commissioned in 12th plan (overall 20%)
Maximum and Minimum Frequency – 1998 Onwards ER/NEW Grid Frequency
Maximum and Minimum Frequency – 2008 Onwards ER/NEW Grid Frequency
Frequency Variations (Maximum - Minimum ) – 1998 Onwards ER/NEW Grid Frequency
Frequency Variations (Maximum - Minimum ) – 2008 Onwards ER/NEW Grid Frequency
Flowgates Nathpa-Jhakri gate Birpara-Salakati Gate Fog gate Gomati Gate Ganga Gate Silchar Gate Mundra Gate W3-ER Gate W3-W2 Gate Eastern Region Gate Godavari Gate Mahanadi Gate W3-W1 Gate BhilaiGate Golden Gate Kaveri Gate Stanley Gate
Congestion Flowgates in Europe Source: 10 year network development plan 2012, ENTSOE