Download

1 / 32
320 likes | 334 Views
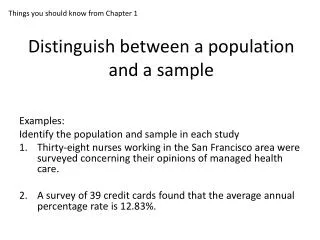
Teaching how to sample in research: some things that might help. Mark NK Saunders. A sampling issue?.

E N D
Teaching how to sample in research: some things that might help Mark NK Saunders
A sampling issue? In February 2011 the UK’s Outdoor Media Centre launched its ‘Hall of Fame’ competition to identify the 100 best advertising posters of all time. Working with the History of Advertising Trust, they generated a list of 500 posters. This was reduced to a shortlist of 228 posters by a committee of media and creative experts together with the editor of weekly magazine - Campaign. These were displayed on a dedicated website www.outdoorhalloffame.co.uk. Creative agencies, media planners, advertisers, media owners and the general public were invited in an article in Campaign to go to the web site, view the advertising campaigns and cast their votes for what they considered to be the best outdoor posters. Each person was able to cast a total of ten votes, the best advertisements being “chosen after more than 10,000 reader votes”.
How might sample selection have affected the results? 1 2 3 5 8 7 6 4
Session Plan • Sampling is not boring –attracting attention • Sampling does not always involve balls and urns –introducing non probability sampling • Sampling does not always require a sampling frame • Sampling and statistics –misconceptions about probability sampling • The sample selected matters –the link with research question • The how many question -the issue of sample size
Attracting attention “A small test of 50 women found almost nine out of 10 of them said their skin looked more luminous after using it, while 72 per cent said fine lines appeared less visible.”
Introducing non probability sampling (2) Guildford • Some implied research questions (students’ suggestions) • How do people manage their careers? • What is the best way to manage a career?
Sampling does not always require a sampling frame… Data collected by… • Catching commuter train from Guildford to London • 2nd class ticket • 5 weeks – Monday to Friday • Interviewing 5 people on average each journey Unclear regarding… • Time of year • How selected participants
The sample selected matters Characteristics of population from which sample selected • Catching commuter train (commuters?) • Living near Portsmouth – Guildford – London line • Working in London • Working “9 to 5” What else?
Sample selected matters (2)… Generalisabiity: the way in which the sample is drawn affects the extent to which the findings can be applied (generalised) or other settings Sample from: • Commuters • Living south of London • Unlikely to be senior managers • Working “9 to 5” • Unlikely to be employed in manufacturing Research Question • People • Living anywhere • With a career • Doing any type of job
So what have we done so far? • Hopefully sampling is not boring –real issue in research • Sampling does not always involve balls and urns –introduced non probability sampling and shown in relation to this… • …sampling does not always rely on a sampling frame –can’t get a list of passengers easily • The sample selected matters…
Testing understanding…What is the relationship between a population and a sample? • The sample is a sub set of the population • The sample is the population • The sample is always representative of the population • The sample is the method by which you select the population www.rwpoll.com 15
Samples … realities in management research (& the Guildford study) REALITIES • Don’t always have sampling frame • Sampling frame often restricted • Difficult to show sample truly random CONSEQUENCES • Population assumed itself to be a random sample from larger population or • Inferences (including statistical) confined to actual population from which sample drawn –can’t generalise statistically • May not be able to answer certain questions … rephrase the question!
Unclear how non-probability sample was drawn Sampling Probability Non-probability Quota Volunteer Purposive Haphazard Snowball Selfselection Quota Convenience But different non-probability techniques would have differing implications Extremecasepurposive Homogeneouspurposive Typicalcasepurposive Critical casepurposive Theoretical Heterogeneouspurposive
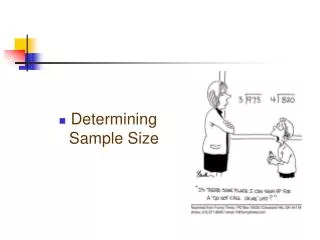
The how many question –what non-probability sample size? • REMEMBER –making generalisations to theory not about a population (except with quota samples) • Sample size depends upon research question and objectives… what need to find out what will be useful what is credible what can be done within available resources Continue until reach data saturation
Non-probability sample size ...more detail Source: Saunders (2012)
Non probability sample selection Justifying choices Following a recipe for Quota sampling
Misconceptions about probability sampling –simple random sampling • Selecting a sample using simple random sampling will select the sample evenly from the population • If a truly random process is used to select a sample from a population, then the resulting sample will be just like the population, but smaller –a miniature replica of the population. • The size of the sample should be proportional to the size of the population. -the ratio of sample size to population size needs to be considered when deciding how large the sample should be. • The larger the sample the greater the accuracy
Misconceptions…-simple random sampling selects evenly • Last five UK lottery draws Look at the pattern of numbers
Misconceptions about probability sampling –miniature replica • Write down your student number. • Then answer the questions on the slide for the last digit of your student number115678 = 8113459 = 9 etc etc • Then, I will show the questions again but this time we will ALL answer them • In comparing the answers, we will be able to see realities of random sampling…. (and of questionnaires!) (Idea from Prof Sam Warren)
I often receive bad service when I am shopping in England (student number ending 1, 4, 5) • Strongly agree • Agree • Neither agree or disagree • Disagree • Strongly disagree
Results –a miniature replica? Variation in number responding Variations in response Impact of larger sample size
Misconception: Sample size is proportional to population(1) The problem of making statistical inferences from a small probability sample Sample size for 95% certainty with 5% margin of error
Probability sample and population size (2) Sample size for 95% certainty with 5% margin of error
Misconception: larger the sample size greater the accuracy • The larger the probability sample size, the more confident can be that represents the true population for a given population size.
Different probability sampling techniques would have different implications (given knew total population) Sampling Probability Simple random Multi-stage Systematic Stratified random Cluster
Probability sampling –following a recipe • How to do it most text books -just follow the recipe…-use practice exercise-justify choices • Key issue is understanding why and implications of what do-discuss case studies...-use multiple choice questions to check http://wps.pearsoned.co.uk/ema_uk_he_saunders_resmethbus_5/111/28550/7309036.cw/index.html
Probability samples … statistical inference • Inferential statistics allow general statements to be made about the population form the sample providing data normally distributed • Betting about the probability of being wrong or inferring invalid conclusions “It is a sad fact that if one knows nothing about the probability of occurrence for a particular sample of units for observation, very little of the inferential machinery … can be applied” (Hays 1994: 227)
But beware of the effect of sample size on practical significance… • The larger the sample size the more likely your results are statistically significant • Statistically significant result - unlikely to have occurred by chance • Practically significant result – practically meaningful in real world Jacob Cohen
Response rates Most important aspect is sample is representative of ... • High response rate can help this • Non-responses different from rest of population as did not respond! Non response due to 4 interrelated problems: • refusal to respond • ineligibility to respond • inability to locate respondent • respondent located but unable to make contact
Bibliography (1) • American Association for Public Opinion Research (2008) Standard Definitions: Final Dispositions of Case Codes and Outcome Rates for Surveys (5th edition) Lenexa, KA: AAPOR • Baruch Y and Holtom BC (2008) Survey response rate levels and trends in organizational research Human Relations 6.8 1139-60. • Groves, R.M., Dillman, D.A., Eltinge, J.L. and Little, R.J.A. (eds.) (2001) Survey Non-response. New York: John Wiley. • Guest, G., Bunce, A. and Johnson, L. (2006). How many interviews are enough? An experiment with data saturation and validity. Field Methods. Vol. 18, No. 1, pp. 59-82 • Lance, C.E. & Vandenberg, R. J. (2009), Statistical and Methodological Myths and Urban Legends. Routledge, London:Taylor & Francis.
Bibliography (2) • Meyer, J.H.F., Shanahan, M.P. & Laugksch, R.C. (2005), “Students’ Conceptions of Research. I: A qualitative and quantitative analysis”, Scandinavian Journal of Educational Research, 49. 3, 225-244. • Patton, M.Q. (2002) Qualitative Research and Evaluation Methods. 3rd edn. Thousand Oaks, CA: Sage, Ch.5 • Rogelberg SG and Stanton JM (2007) Introduction: Understanding and dealing with organizational survey non-response Organizational Research Methods 10.2 195-209 • Saunders, M.N.K., Lewis, P. and Thornhill, A. (2012) Research Methods for Business Students. 6th edn. London: FT Prentice Hall, Ch.7. • Saunders M.N.K. (2012) ‘Choosing research participants’ in G Symons and C Cassell (eds) The Practice of Qualitative Organizational Research: Core Methods and Current Challenges.London: Sage 37-55