International Student Proficiency Levels: 2012-2009 Comparisons
Explore the performance of students from OECD countries, including the U.S., in mathematics, science, and reading literacy assessments between 2006-2012. Compare correct answer rates to OECD averages, highlighting areas of strength and improvement.

International Student Proficiency Levels: 2012-2009 Comparisons
E N D
Presentation Transcript
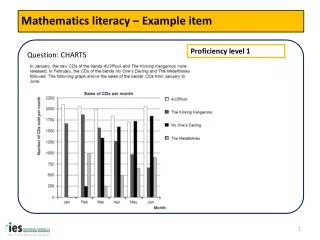
Mathematics literacy – Example item Proficiency level 1 Question: CHARTS
Mathematics literacy – Example item Question: CHARTS - Continued Percentage of students answering correctly in 2012: OECD average: 80% U.S.: 77%
Mathematics literacy – Example item Proficiency level 5 Question: DRIP RATE
Mathematics literacy – Example item Question: DRIP RATE - Continued Percentage of students answering correctly in PISA 2012: OECD average: 26% U.S.: 30%
Science literacy – Example item Question: MARY MONTAGU Proficiency level 2
Science literacy – Example item Question: MARY MONTAGU - Continued Percentage of students answering correctly in 2006: OECD average: 75% U.S.: 73%
Science literacy – Example item Question: GREENHOUSE Proficiency level 6
Science literacy – Example item Question: GREENHOUSE - Continued Percentage of students answering correctly in 2006: OECD average: 19% U.S.: 18%
Reading literacy – Example item Question: TELECOMMUTING Proficiency level 3
Reading literacy – Example item Question: TELECOMMUTING-Continued Percentage of students answering correctly in 2009: OECD average: 52% U.S.: 55%
Reading literacy – Example item Question: THE PLAY’S THE THING Proficiency level 6
Reading literacy – Example item Question: THE PLAY’S THE THING- Continued What were the characters in the play doing just before the curtain went up? Percentage of students answering correctly in PISA 2009: OECD average: 13% U.S.: 13%