Download

1 / 26
260 likes | 398 Views
Tag Ranking. Present by Jie Xiao. Dept. of Computer Science Univ. of Texas at San Antonio. Outline. Problem Probabilistic tag relevance estimation Random walk tag relevance refinement Experiment Conclusion. Problem.

E N D
Tag Ranking Present by Jie Xiao Dept. of Computer Science Univ. of Texas at San Antonio
Outline • Problem • Probabilistic tag relevance estimation • Random walk tag relevance refinement • Experiment • Conclusion jxiao@cs.utsa.edu
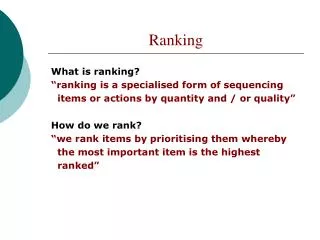
Problem • There are millions of social images on internet, which are very attractive for the research purpose. • The tags associated with images are not ordered by the relevance. jxiao@cs.utsa.edu
Problem (Cont.) jxiao@cs.utsa.edu
Tag relevance • There are two types of relevance to be considered. • The relevance between a tag and an image • The relevance between two tags for the same image. jxiao@cs.utsa.edu
Probabilistic Tag Relevance Estimation • Similarity between a tag and an image x : an image t : tag i associated with image x P(t|x) : the probability that given an image x, we have the tag t. P(t) : the prior probability of tag t occurred in the dataset After applying Bayes’ rule, we can derive that jxiao@cs.utsa.edu
Probabilistic Relevance Estimation (Cont) • Since the target is to rank that tags for the individual image and p(x) is identical for these tags, we refine it as jxiao@cs.utsa.edu
Density Estimation • Let (x1, x2, …, xn) be an iid sample drawn from some distribution with an unknown density ƒ. • Two types of methods to describe the density • Histogram • Kernel density estimator jxiao@cs.utsa.edu
Histogram Credit: All of Nonparametric Statistics via UTSA library jxiao@cs.utsa.edu
Kernel Density Estimation Smooth function K is used to estimate the density jxiao@cs.utsa.edu
Kernel Density Estimation (Cont.) • Its kernel density estimator is jxiao@cs.utsa.edu
Probabilistic Relevance Estimation (Cont) • Kernel Density Estimation (KDE) is adopted to estimate the probability density function p(x|t). Xi : the image set containing tag ti xk : the top k near neighbor image in image set Xi K : density kernel function used to estimate the probability |x| : cardinality of Xi jxiao@cs.utsa.edu
Relevance between tags • ti, tag i associated with image x • tj, tag j associated with image x • , the image set containing tag i • , the image set containing tag j • N: the top N nearest neighbor for image x jxiao@cs.utsa.edu
Relevance between tags (Cont.) jxiao@cs.utsa.edu
Relevance between tags (Cont.) • Co-occurrence similarity between tags f(ti) : the # of images containing tag ti f(ti,tj) : the # of images containing both tag ti and tag tj G : the total # of images in Flickr jxiao@cs.utsa.edu
Relevance between tags (Cont.) jxiao@cs.utsa.edu
Relevance between tags (Cont.) • Relevance score between two tags where jxiao@cs.utsa.edu
Random walk over tag graph P: n by n transition matrix. pij : the probability of the transition from node i to j rk(j): relevance score of node i at iteration k jxiao@cs.utsa.edu
Random walk jxiao@cs.utsa.edu
Random walk over tag graph (Cont.) jxiao@cs.utsa.edu
Experiments • Dataset: 50,000 image crawled from Flickr • Popular tags: • Raw tags: more than 100,000 unique tags • Filtered tags: 13,330 unique tags jxiao@cs.utsa.edu
Performance Metric • Normalized Discounted Cumulative Gain (NDCG) r(i) : the relevance level of the i - th tag Zn : a normalization constant that is chosen so that the optimal ranking’s NDCG score is 1. jxiao@cs.utsa.edu
Experimental Result • Comparison among different tag ranking approaches jxiao@cs.utsa.edu
Conclusion • Estimate the tag - image relevance by kernel density estimation. • Estimate the tag – tag relevance by visual similarity and tag co-occurrence. • A random walk based approach is used to refine the ranking performance. jxiao@cs.utsa.edu
Thank you! jxiao@cs.utsa.edu