Download
1 / 58
620 likes | 1.1k Views
A STUDY ON PROBABILISTIC EVALUATION OF SOIL LIQUEFACTION. Chi, Yao-Yao and Ou, Li-Ting. Speaker : Yun-yao Chi Department of Land Management and Development Chang Jung Christian University Tainan, Taiwan. Outline. INTRODUCTION THE MODEL DEVELOPMENT

E N D
A STUDY ON PROBABILISTIC EVALUATION OF SOIL LIQUEFACTION Chi, Yao-Yao and Ou, Li-Ting Speaker : Yun-yao Chi Department of Land Management and Development Chang Jung Christian University Tainan, Taiwan
Outline • INTRODUCTION • THE MODEL DEVELOPMENT • EVALUATION STEPS FOR AVERAGE ANNUAL LIQUEFACTION PROBABILITY • CASE STUDY • CONCLUSIONS
Recently, some large earthquakes occurred in the worldwide, that always bring soil liquefaction and the liquefaction areas usually cause serious damages. • The evaluation of soil liquefaction potential has become one of more important topics in the area of earthquake hazard research topics over the past two decades.
Why Probabilistic Evaluation of Liquefaction ? • The unpredictability of the earthquake loading • The unavoidable error in the modeling of the soil behavior • The uncertainty of soil parameters • A comparison of the liquefaction opportunity to other natural disasters for land use risk
A new evaluation method of average annual liquefaction probability (AALP) was developed on the basis of both : Davies and Berrill’s(1982) seismic energy dissipation theory and Juang and Chen’s(2000) limit state approach to change seismic loading searching for the liquefaction and non-liquefaction curve.
Seismic Energy Dissipation Model • The seismic energy dissipation model is to explain the simple relationship giving the increase in excess pore pressure and is traced as a function of (1) the earthquake magnitude, (2) its distance from site, (3) the SPT-N value, (4) the initial effective overburden stress,
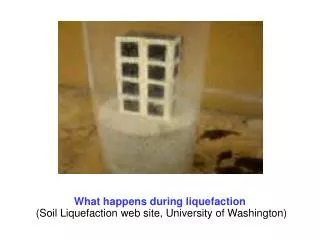
Cont. ……..(1) • When the ratio of the excess pore pressure to the effective overburden stress equals to one, then the soil liquefaction occurs. As a result is now rewritten as: ……..(2)
Annual Probability of Liquefaction • Gutenberg and Richter’s [14] probabilistic seismic hazard analysis. .…….(3) • From this equation we have ……..(4) Log(n)= log(T)-bm
Cont.(1) • Using equation (1) in equation (4) gives .…….(5)
Cont.(2) • Davies and Berrill’s cumulative probability of liquefaction, we can integrate over the length of the fault, where a uniform probability of earthquake occurrence is assumed along with the fault. ..……(6)
Cont.(3) • Assuming the occurrence of earthquakes along with the fault is viewed as a Poisson process, the annual probability of liquefaction is given by …….(7)
fault Cont.(4) • Using equation (6) in equation (7) gives …….(8) Fig. 1 Linear Fault and Potential Liquefaction Site
Cont.(5) • According to the combinatorial reliability concept, then the N components represent N faults, hence the annual probability of liquefaction for multiple faults, we have ……..(9)
The limit state function According to Eq.(2), show a muti-dimensional plot indicating the limit state function. The concept of Juang limit state Change seismic loading searching for liquefaction/non-liquefaction curve . Limit State Liquefied Zone Seismic Load Non-liquefied Zone Normalized In-Situ Soil Strength The Constant
Cont.(1) • Data obtained from 94 field historical records of SPT-N, and are used to search for peak horizontal acceleration (PHA) when the liquefaction safety factor (Fs=1) by Seed’s simplified methodthrough change seismic loading • Obtained epicenter distance (R) in the limit state through the PHA attenuation relationship by Campbell(1981). ……..(10)
Cont.(2) • A limit state of liquefaction and non-liquefaction by using non-liner regression analysis in the SPSS software, we have ……..(11) • Using Eq.(11) contrast with Eq.(2) to obtain: A=0.001236, B=3.244, C=1.106 and D=0.974.
Cont.(3) Fig. 3 Limit State Boundary Regressed by Initial Liquefaction Data.
Cont.(4) • Similarly, using the historical records has not changed seismic loading , the boundary probability of successful in judgment on liquefaction and non-liquefaction is 80% (Fig. 4)
Cont.(5) Fig.4 The Historical Records Divided by Limit State Boundary
EVALUATION STEPS FOR THE AVERAGE ANNUAL LIQUEFACTION PROBABILITY(AALP)
AALP Based on Statistical Theory • Lee (2001) had presented the statistical probability of liquefaction analysis. • We integrate the probabilistic seismic hazard analysis to compute earthquake magnitude and the peak horizontal acceleration within some return period. • Combining these methods, we can establish the evaluation steps for the AALP based on statistic theory, as follows.
Cont.(1) • Step1. Used of the probabilistic seismic hazard analysis to compute earthquake magnitude and peak horizontal acceleration.
Cont.(2) • Step2. Using result of step1 substitution the statistical probability based on existing simplified methods by Youd and Idriss, is to calculate coefficient of variation of CRR and CSR for each soil layer.
Cont.(3) • Step3. The result of step2 substitution equation (13) could obtain probability of liquefaction for each soil layer. ……..(13)
Cont.(4) • Step4. According to Bayes’ theorem we can compute the AALP by using divided soil layers within the 20m depth. Thus, we have .…….(14)
Cont.(5) • Step5. According to equation (9) combine the AALP of divided soil layer based on different faults. ..……(9)
AALP Based on Seismic Energy Dissipation Model • Step1.Earthquake sources and parameters In Taiwan Western, earthquake source is linear source. According to Cheng et al.(1998), Yunlin area is located in the E earthquake source and the seismic parameter b =1.087, a=4.348
Cont.(1) • Step2. Average annual probability of liquefaction The above procedure creates seismic parameters that substitution equation (8) could obtain ALP of each soil layer. According to equation (9) could combine ALP of each soil layer based on different faults, and then calculated the AALP of divided soil layer to represented the hole liquefaction probability.
Cont.(2) • Step3. The above procedure creates the AALP that reciprocal is average return period of liquefaction. ……..(16)
Taichung County Chelungpu Fault Zhang-Hua County Yunlin Epicenter The liquefied Area in 1999 Chi-Chi Earthquake Liquefied area
The Yunlin liquefied Area in 1999 Chi-Chi Earthquake • 45 bore logging records from Yunlin area, are obtained from the Moh and Associates Consulting Engineers Company. (MACE). • Including 15 cases representing site that liquefied during 1999 Chi-Chi earthquake, 11 cases of non-liquefied and 19 cases of unknown.
Subsurface Soil Layer Characteristics in Yunlin Area • Five cross-sections shown in Fig. 6. These cross sections cut across the study area from west to east including three cross-sectional profiles and from north to south including two cross-sectional profiles. • Subsurface soil layer conditions are illustrated by the five cross-sectional profiles shown in Fig.7~11.
E D A B C Fig. 6. Location Map for SPT Boring Holes and Cross-Sections through Map Zone
Cont.(1) Fig. 7. The Soil and ALP Profile of A Section
Cont.(2) Fig. 8. The Soil and ALP Profile of B Section
Cont.(3) Fig. 9. The Soil and ALP Profile of C Section
Cont.(4) Fig. 10. The Soil and ALP Profile of D Section
Cont.(5) Fig. 11. The Soil and ALP Profile of E Section
The Results of the Seismic Energy Dissipation Model • 45 input case records to yield the AALP based on Chelungpu fault and Zhanghua fault. • Six data points, BH-41, -12, -27, -7, -25 and -43 are particularly bothersome in that they appear to contradict the investigation results after Chi-Chi earthquake. • Roughly, the developed model yields an overall success rate of 87% in predicting both liquefied and non-liquefied tendency.
TABLE 1. AALP and Return period Based on Seismic Energy Dissipation Model Note. a: the AALP of over hole based on depth weighted averages method by Iwasaki b: N is mean non-liquefied ; Y is mean liquefied; NA is mean unknown
Cont. TABLE2. AALP and Return period Based on Seismic Energy Dissipation Model in Lunya
A Comparison of the Seismic Energy Dissipation Model to the Statistical Model • In a typical field investigation, the sites that have no evidence of liquefaction are less likely to investigate. • The AALP calculated by seismic energy dissipation model compared to that calculated by statistical model.
Cont. Fig.12 Relationship between Statistical Model and Seismic Energy Dissipation Model for AALP
The Map of AALP Based on the Seismic Energy Dissipation Model • shows that the AALP of the surface sand layer is greater than the second sand layer, and the results conform to the generally assumption. • Lunya neighborhood has the highest AALP, and these results are similar to previous investigation results in Yunlin after the Chi-Chi earthquake..