Download
1 / 17
720 likes | 1.78k Views
Interest Rate Risk I Chapter 8. Financial Institutions Management, 3/e By Anthony Saunders. Central Bank and Interest Rate Risk. Effects of interest rate targeting. Lessens interest rate risk October 1979 to October 1982, nonborrowed reserves target regime.

E N D
Interest Rate Risk IChapter 8 Financial Institutions Management, 3/e By Anthony Saunders
Central Bank and Interest Rate Risk • Effects of interest rate targeting. • Lessens interest rate risk • October 1979 to October 1982, nonborrowed reserves target regime. • Implications of return to reserves target policy: • Increases importance of measuring and managing interest rate risk.
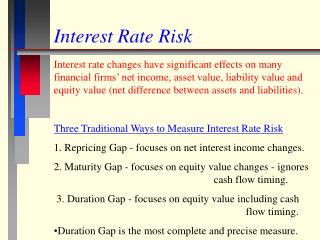
Repricing Model • Repricing or funding gap model based on book value. • Contrasts with market value-based maturity and duration models. • Rate sensitivity means time to repricing. • Repricing gap is the difference between the rate sensitivity of each asset and the rate sensitivity of each liability: RSA - RSL.
Maturity Buckets • Commercial banks must report repricing gaps for assets and liabilities with maturities of: • One day. • More than one day to three months. • More than 3 three months to six months. • More than six months to twelve months. • More than one year to five years. • Over five years.
Repricing Gap Example AssetsLiabilitiesGap Cum. Gap 1-day $ 20 $ 30 $-10 $-10 >1day-3mos. 30 40 -10 -20 >3mos.-6mos. 70 85 -15 -35 >6mos.-12mos. 90 70 +20 -15 >1yr.-5yrs. 40 30 +10 -5 >5 years 10 5 +5 0
Applying the Repricing Model • DNIIi = (GAPi) DRi = (RSAi - RSLi) Dri • Example: In the one day bucket, gap is -$10 million. If rates rise by 1%, DNIIi = (-$10 million) × .01 = -$100,000. • Example II: If we consider the cumulative 1-year gap, DNIIi = (CGAPi) DRi = (-$15 million)(.01) = -$150,000.
Rate-Sensitive Assets • Examples from hypothetical balance sheet: • Short-term consumer loans. If repriced at year-end, would just make one-year cutoff. • Three-month T-bills repriced on maturity every 3 months. • Six-month T-notes repriced on maturity every 6 months. • 30-year floating-rate mortgages repriced (rate reset) every 9 months.
Rate-Sensitive Liabilities • RSLs bucketed in same manner as RSAs. • Demand deposits and passbook savings accounts warrant special mention. • Generally considered rate-insensitive, but there are arguments for their inclusion as rate-sensitive liabilities.
CGAP Ratio • May be useful to express CGAP in ratio form as, CGAP/Assets. • Provides direction of exposure and • Scale of the exposure.
Weaknesses of Repricing Model • Weaknesses: • Ignores market value effects • Overaggregative • Distribution of assets & liabilities within individual buckets is not considered. Mismatches within buckets can be substantial. • Ignores effects of runoffs • Bank continuously originates and retires consumer and mortgage loans. Runoffs may be rate-sensitive.
The Maturity Model • Explicitly incorporates market value effects. • For fixed-income assets and liabilities: • Rise (fall) in interest rates leads to fall (rise) in market price. • The longer the maturity, the greater the effect of interest rate changes on market price. • Fall in value of longer-term securities increases at diminishing rate for given increase in interest rates.
Maturity of Portfolio • Maturity of portfolio of assets (liabilities) equals weighted average of maturities of individual components of the portfolio. • Principles stated on previous slide apply to portfolio as well as to individual assets or liabilities. • Typically, MA - ML > 0 for most banks and thrifts.
Effects of Interest Rate Changes • Size of the gap determines the size of interest rate change that would drive net worth to zero. • Immunization and effect of setting MA - ML = 0.
Maturity Matching and Interest Rate Exposure • If MA - ML = 0, is the FI immunized? • Extreme example: Suppose liabilities consist of 1-year zero coupon bond with face value $100. Assets consist of 1-year loan, which pays back $99.99 shortly after origination, and 1¢ at the end of the year. Both have maturities of 1 year. • Not immunized, although maturities are equal. • Reason: Differences in duration.
*Term Structure of Interest Rates YTM YTM Time to Maturity Time to Maturity Time to Maturity Time to Maturity
*Unbiased Expectations Theory • Yield curve reflects market’s expectations of future short-term rates. • Long-term rates are geometric average of current and expected short-term rates. __~~ RN = [(1+R1)(1+E(r2))…(1+E(rN))]1/N - 1
*Liquidity Premium Theory • Allows for future uncertainty. • Premium required to hold long-term. *Market Segmentation Theory • Investors have specific needs in terms of maturity. • Yield curve reflects intersection of demand and supply of individual maturities.