Download
1 / 81
810 likes | 1k Views
Social Network Analysis. Session 1 Introduction and Research Basics. Course Overview. Session 1: Social Network Analysis An introduction and grounding in the basics Session 2: Organisational Network Analysis Networks as metaphor, and organizational metrics

E N D
Social Network Analysis Session 1 Introduction and Research Basics
Course Overview • Session 1: Social Network Analysis • An introduction and grounding in the basics • Session 2: Organisational Network Analysis • Networks as metaphor, and organizational metrics • Session 3: Organisational Process Mapping • Process flow charts as networks, diagnosis • Session 4: Strategic Networking • Network building and use
Session 1 Overview • Introduction and History of SNA • Graph theory, anthropology, sociology • Mapping a network • Social network metrics • Homophily, clusters, social capital • Analysing an egocentric network
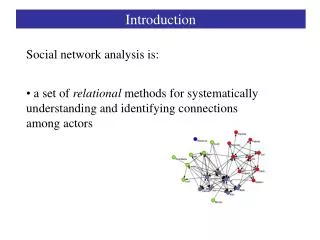
Defining Social Network Analysis • At its simplest a network can be considered a ‘set of relations’. • “A social network is a structure composed of a set of actors, some of whose members are connected by a set of one or more relations” (Knoke and Yang 2008)
Features of SNA • SNA is motivated by a structural intuition based on ties linking social actors • Grounded in systematic empirical* data • Draws heavily on graphic imagery • Relies on the use of mathematical and/or computational model (Freeman 2004: 3)
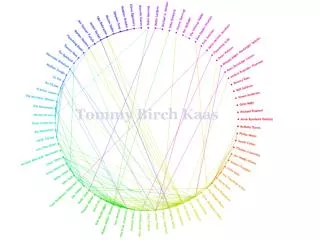
Sociograms • “A process of charting has been devised by the sociometrists, the sociogram, which is more than merely a method of presentation. It is first of all a method of exploration. It makes possible the exploration of sociometric facts. The proper placement of every individual and of all interrelations of individuals can be shown on a sociogram. It is at present the only available scheme which makes structural analysis of a community possible.” (Moreno 1953, pp. 95-96)
Six degrees of separation • http://www.facebookstories.com/stories/1574/interactive-mapping-the-world-s-friendships#color=continent&story=1&country=AU
Sociometry • Sociometry is the study of bounded groups or “whole networks”. • Boundaries are set usually by relation (connection to other members) or association (sharing a quality).
Multiplexity • Social network analysts suppose that multiplex relations are likely to foster reciprocity, trust, commitment, reputation, interdependence, and strength.
2-mode • A (2-dimensional) matrix is said to be 2-mode if the rows and columns index different sets of entities • Networks are formed through affiliation and association
Egocentric • Egocentric research focuses on an individual’s relations to others • Relationships are defined by the participant, in relation to the participant
Egocentric • Primarily collected through interviews • Name generators: • Single • Multiple (e.g. Ronald S. Burt)
Map Your Own Egonet • Write your name on a post-it and put it in the centre of the template • “Who is important to you?” – Using the post-it notes write down the names of the people who are important or close to you • Using the template, situate these people according to how they are related to you and how close they are to you • Fill in the connections between everyone (except yourself)
Social capital • The OECD defines social capital as 'networks, together with shared norms, values and understandings which facilitate cooperation within or among groups'
Homophily • Homophily is the tendency for people to associate with those who are like themselves in one form or another (Lazarsfeld and Merton 1948, McPherson, Smith-Lovin and Cook 2001)
Types of Homophily • Status homophily • Age, gender, race, ethnicity • Occupation, education • Class • Value homophily • Morals, ethics, religious beliefs • Political affiliation • Climate deniers, anti-vaxxers, conspiracy theorists
Social capital • Collected through surveys and interviews • Resource generator (Van der Gaag and Snijders 2005) • Position generator (Lin, Fu & Hsung 2001)
Types of Social Capital • Financial aid • Material support • Moving house, watering plants, fixing a bike • Emotional support • Intellectual knowledge • Financial advice, legal advice, professional knowledge
Cluster Analysis • Finds the ‘groups’ in the network • Boundaries can be defined along any lines • Smallest cluster is 3 people (triad) • Can be ‘loose’ or ‘tight’ knit, can overlap • Clusters promote cohesion • Groups can also be exclusive, and/or secretive
Types of Clusters • Spatially defined • Work units, work places • Organisations • Neighbourhoods, churches, schools, frequently visited places and spaces • Relationally defined • Shared interests, shared history • Usually relationships of choice rather than circumstance • Often develop out of spatially defined relationships
Analysing Your Network • Clusters: why are the people in your network grouped as they are? (Name the groups) • Homophily: how alike are the people connected together? In what ways? (Code the people and connections) • Social capital: what help could you expect from the people in your network? How likely are you to draw upon that capital?
Organisational Network Analysis Session 2
Session 2 Overview • Networks as metaphor • Internal and external boundaries • Mapping an organisational network • Organisational network metrics • Structural holes, flows, brokerage, strength of weak ties • Analysing an organisational network
Networks as metaphor Networks are the connections between the individuals in an organisation The connections aren’t constrained by organisational structure The network encompasses all forms of interpersonal connections, from professional to intimate
Advantages • Identify core personnel (often mid-level) • these people may be highly influential, or bottlenecks in the network • Identify peripheral personnel • may have skills that are underutilised, lack engagement or are excluded from the network • Identify sub-groups and disconnects (silos) • groups that are cliquey, poorly connected (perhaps through upper management), or not connected to the rest of the organisation
Tracing the network • Connections in organisational networks are likely to be more dense around organisational units • It should be possible to trace the hierarchy of an organisation within the network • Connections are not necessarily reciprocal, if one person is reporting to another
Tracing the network (cont.) • Many relationships do not expire • Relationships can be negative • Relationships can be secretive or hidden
Internal vs External Networks • The same principles apply to the connections between individuals in different organisations • Inter-organisational networks are facilitated by individuals making informal connections as much as formal relationships
Why inter-organisational networks? • Outsourcing • Increasing size of effect without increasing organisation size • Cooperation, coordination, collaboration
Map your organisational network • In the same way that you mapped your egonet, map out your organisational network • Organisational unit • Hierarchy (above and below) • Other people in your organisation you know • Use the length of the template for hierarchy, the width of the template for closeness • Identify the external stakeholders that you connect with (outside the internal walls) • To your best ability add in those individuals who are significant in your network that you are not directly connected to • Draw in the relationships that you are certain of
Structural Holes • Structural holes occur when an individual ‘bridges’ across two otherwise unconnected groups • The ‘central actor’ has an advantage in that they have access to resources that others in their network do not
Brokerage • Brokerage
Global Metrics • Global metrics require considerable computational power, and ‘whole’ network data • Density is the proportion of connections that exist out of all possible connections • Average degree is the average number of connections that each node has to their partners
Global metrics (cont.) • Degree centrality is a measure of how centralised the network is around a small proportion of nodes • Betweenness measures how frequently the same nodes appear on the paths between nodes • Closeness measures how well connected the network is on average • The cohesion measures indicate how tight knit the network is, in sub-groupings and as a whole
For tomorrow • Tomorrow’s first session involves organisational process flow charts like these • Given the focus on real world examples, it would be very helpful if you had one of these from your own area for use tomorrow • No engineering flow charts!
Organisational Process Mapping Session 3
Session 3 Overview • Process flow charts • The embodiment of organisational processes • Mapping a process network • Diagnosing process network issues • Using process flow models and • Analysing process network
Process flow • “A method of visually documenting the stages involved in performing a certain business procedure. A type of process flow popular among business managers might take the form of flow charts that show inputs or information requests, followed by each of the steps required to create deliverable outputs such as products or services from the inputs”1 • http://www.businessdictionary.com/definition/process-flow.html.