Download
1 / 21
210 likes | 227 Views
Explore fundamental environmental science concepts such as greenhouse effect, biodiversity, renewable resources, and more through interactive questions and illustrations.

E N D
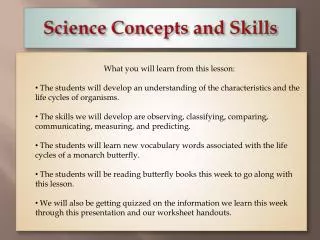
Preview • Science Concepts • Using Science Graphics • Math Skills
1. What is the term for the natural ability of Earth’s atmosphere to trap energy from the sun? • A. global warming • B. ozone depletion • C. greenhouse effect • D. biological magnification
1. What is the term for the natural ability of Earth’s atmosphere to trap energy from the sun? • A. global warming • B. ozone depletion • C. greenhouse effect • D. biological magnification
2. Which of the following terms means “liquid precipitation that has a low pH and that results from sulfur emissions reacting with water”? F. acid rain G. sulfuric acid H. greenhouse gas J. thermal pollution
2. Which of the following terms means “liquid precipitation that has a low pH and that results from sulfur emissions reacting with water”? F. acid rain G. sulfuric acid H. greenhouse gas J. thermal pollution
3. What does Earth’s ozone layer shield Earth’s inhabitants from? A. solar heating B. meteor impacts C. ultraviolet rays D. ozone depletion
3. What does Earth’s ozone layer shield Earth’s inhabitants from? A. solar heating B. meteor impacts C. ultraviolet rays D. ozone depletion
4. Which of the following describes the variety of species in an area? F. biodiversity G. species richness H. species evenness J. bioindicator species
4. Which of the following describes the variety of species in an area? F. biodiversity G. species richness H. species evenness J. bioindicator species
5. Which of the following is a renewable resource? A. coal B. trees C. gasoline D. natural gas
5. Which of the following is a renewable resource? A. coal B. trees C. gasoline D. natural gas
6. Which of the following is a process in which materials of Earth’s surface are worn away and transported from on place to another by wind, gravity, or water? F. erosion G. terracing H. disruption J. deforestation
6. Which of the following is a process in which materials of Earth’s surface are worn away and transported from on place to another by wind, gravity, or water? F. erosion G. terracing H. disruption J. deforestation
Use the diagram shown below to answer the next question. 7. What is the term commonly used to describe the trend shown in this graph? A. water pollution B. global warming C. ozone depletion D. biodiversity crisis
Use the diagram shown below to answer the next question. 7. What is the term commonly used to describe the trend shown in this graph? A. water pollution B. global warming C. ozone depletion D. biodiversity crisis
Use the diagram shown below to answer the next question. 8. Which country has the most people per square mile? F. Japan G. United States H. Indonesia J. Japan and Indonesia
Use the diagram shown below to answer the next question. 8. Which country has the most people per square mile? F. Japan G. United States H. Indonesia J. Japan and Indonesia
Use the diagram shown below to answer the next question. 9. Which country produces the greatest amount of garbage per square mile? A. Japan B. United States C. Indonesia D. Japan and Indonesia
Use the diagram shown below to answer the next question. 9. Which country produces the greatest amount of garbage per square mile? A. Japan B. United States C. Indonesia D. Japan and Indonesia
10. An oil tanker hit a coral reef and spilled 800,000 mL of oil into the ocean. If the oil spread evenly over 100 km2, how many liters of oil does each square kilometer contain?
10. An oil tanker hit a coral reef and spilled 800,000 mL of oil into the ocean. If the oil spread evenly over 100 km2, how many liters of oil does each square kilometer contain? 800,000 mL 1 L/1000 mL = 800 L; 800 L/100 km2 = 8 L/km2