Download
1 / 49
490 likes | 511 Views
Test & Analysis Project develops a statistical analysis system for Geant4 physics testing. Main application areas include comparing simulation results with reference data, experimental measurements, and theoretical calculations. The project aims to provide tools for users to verify results, document requirements, and perform various types of testing.

E N D
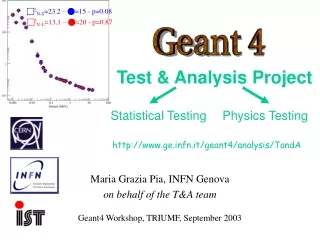
2N-S=23.2 – =15 - p=0.08 2N-L=13.1 – =20 - p=0.87 Test & Analysis Project Statistical Testing Physics Testing Maria Grazia Pia, INFN Genova on behalf of the T&A team http://www.ge.infn.it/geant4/analysis/TandA Geant4 Workshop, TRIUMF, September 2003
physics validation • regression testing • system testing Test & Analysis Project • Test & Analysis is a project to develop a statistical analysis system for usage in Geant4 testing • Main application areas • Provide tools to compare Geant4 simulation results with reference data • equivalent reference distributions (for instance, regression testing) • experimental measurements • data libraries from reference distribution sources • functions deriving from theoretical calculations or from fits
Other potential users: users of the Geant4 Toolkit, to verify the results of their applications with respect to reference data or their own experimental results • provide and documentrequirements • provide feedback on prototypes • perform beta testing • provideuse casesfor acceptance testing Physics Developers • provide and documentrequirements • perform formalacceptance testing STT Users + users of the standalone Statistical Toolkit
History • “Statistical testing” agreed as a collaboration-wide goal 2001-2002 • Initial ideas for this project presented at a TSB meeting, ~end 2001 • Informal discussions, spring – summer 2002 • Test & Analysis Project launched at Geant4 Workshop 2002 Statistical Toolkit Project Physics Testing Project
Set of goodness of fit tests chi squared, Kolmogorov-Smirnov, Cramer-von Mises, Anderson-Darling, etc. Set of Geant4 physics tests cross sections, stopping powers, angular distributions, etc. Statistical Toolkit Project Physics Testing Project Architecture use GoF component Geant4 Physics Test Provide statistics algorithms to compare various kinds of distributions i.e. binned, unbinned, continuous, multi-dimensional, affected by experimental errors, … Provide distributions of physical quantities of interest, to be compared to reference ones
Pablo Cirrone (INFN) Stefania Donadio (INFN) Susanna Guatelli (INFN) Alfonso Mantero (INFN) Barbara Mascialino (INFN) Luciano Pandola (INFN) Sandra Parlati (INFN) Andreas Pfeiffer (CERN) MG Pia (INFN) Alberto Ribon (CERN) Simona Saliceti (INFN) Paolo Viarengo (IST) S. Donadio F. Fabozzi S. Guatelli L. Lista B. Mascialino A. Pfeiffer MG Pia A. Ribon P. Viarengo discussions with Fred James, Louis Lyons, Giovanni Punzi Developers HEPstatistics Team Collaboration: G. Cosmo, V. Ivanchenko, M. Maire, S. Sadilov, L. Urban Production resources: Gran Sasso Laboratory
Scope Architecture Software process Statistical algorithms Current status HEPstatistics Scope Physics tests Results Resources needed This workshop: discuss results, open problems discuss integration in regular Geant4 testing agree on future plans synergy with Geant4 Physics Book One year later... Statistics Physics
Statistical Testing Project GoF component of HEPstatistics
What is? A project to develop a statistical comparison system Provide tools for the statistical comparison of distributions • equivalent reference distributions • experimental measurements • data from reference sources • functions deriving from theoretical calculations or fits Physics analysis Simulation validation Detector monitoring Regression testing Reconstruction vs. expectation Main application areas:
Vision: the basics • Have a vision for the project • Motivated by Geant4 • First core of a statistics toolkit for HEP • Rigorous software process Clearly define scope, objectives Who are the stakeholders? Who are the users? Who are the developers? Clearly define roles Software quality Flexible, extensible, maintainable system Build on a solid architecture
User Requirements Document http://www.ge.infn.it/geant4/analysis/HEPstatistics/ Specific requirements: capability requirements Comparing distributions (2, KSG, KS, AD, CVM, Kuiper, Lilliefors, list of histograms, select the proper algorithm) Converting distributions (binned unbinned) Confidence levels Handling distributions (mono/many dim. distributions , reduce dimensionality, filters, toy MonteCarlo) Treatment of errors (handle statistical and systematic experimental errors) Plotting (original, normalised, cumulative distributions)
Architectural guidelines • The project adopts a solid architectural approach • to offer the functionalityand the quality needed by the users • to be maintainable over a large time scale • to be extensible, to accommodate future evolutions of the requirements • Component-based approach • to facilitate re-use and integration in diverse frameworks • AIDA • adopt a (HEP) standard • no dependence on any specific analysis tool • Python • for interactivity • The approach adopted is compatible with the recommendations of theLCG Architecture Blueprint RTAG
Software process guidelines • USDP, specifically tailored to the project • practical guidance and tools from the RUP • both rigorous and lightweight • mapping onto ISO 15504 • Guidance from ISO 15504 • standard! • Incremental and iterative life cycle model • Various software process artifacts available on the web • Vision • User Requirements • Architecture and Design model • Traceability matrix • etc.
Historical introduction to EDF tests • In 1933 Kolmogorov published a short but landmark paper on the Italian Giornale dell’Istituto degli Attuari. He formally defined the empirical distribution function (EDF) and then enquired how close this would be to the true distribution F(x) when this is continuous. • It must be noticed that Kolmogorov himself regarded his paper as the solution of an interesting probability problem, following the general interest of the time, rather than a paper on statistical methodology. • After Kolmogorov article, over a period of about 10 years, the foundations were laid by a number of distinguished mathematicians of methods of testing fit to a distribution based on the EDF (Smirnov, Cramer, Von Mises, Anderson, Darling, …). • The ideas in this paper have formed a platform for vast literature, both ofinteresting and important probability problems, and also concerning methods of using the Kolmogorov statistics for testing fit to a distribution. The literature continues with great strength today showing no sign to diminish.
Goodness-of-fit tests • Pearson’s c2 test • Kolmogorov test • Kolmogorov – Smirnov test • Goodman approximation of KS test • Lilliefors test • Fisz-Cramer-von Mises test • Cramer-von Mises test • Anderson-Darling test • Kuiper test • … It is a difficult domain… Implementing algorithms is easy But comparing real-life distributions is not easy Incremental and iterative software process Collaboration with statistics experts Patience, humility, time… System open to extension and evolution Suggestions welcome!
Simple user layer • Shields the user from the complexity of the underlying algorithms and design • Only deal withAIDA objectsand choice ofcomparison algorithm
Traceability http://www.ge.infn.it/geant4/analysis/HEPstatistics/ • Requirements • Design • Implementation • Test & test results • Documentation (coming...)
Pearson’s c2 • Applies to binned distributions • It can be useful also in case of unbinned distributions, but the data must be grouped into classes • Cannot be applied if the counting of the theoretical frequencies in each class is < 5 • When this is not the case, one could try to unify contiguous classes until the minimum theoretical frequency is reached
The easiest among non-parametric tests Verify the adaptation of a sample coming from a random continuous variable Based on the computation of the maximum distance between an empirical repartition function and the theoretical repartition one Test statistics: D = sup | FO(x) - FT(x)| ORIGINAL DISTRIBUTIONS Kolmogorov test EMPIRICAL DISTRIBUTION FUNCTION
Problem of the two samples mathematically similar to Kolmogorov’s Instead of comparing an empirical distribution with a theoretical one, try to find the maximum difference between the distributions of the two samples Fn and Gm: Dmn= sup |Fn(x) - Gm(x)| Can be applied only to continuousrandom variables Conover (1971) and Gibbons and Chakraborti (1992) tried to extend it to cases of discrete random variables Kolmogorov-Smirnov test
Goodman approximation of K-S test • Goodman (1954) demonstrated that the Kolmogorov-Smirnov exact test statistics Dmn= sup |Fn(x) - Gm(x)| can be easily converted into a 2: 2 = 4D2mn [m*n / (m+n)] • This approximated test statistics follows the 2 distribution with 2 degrees of freedom • Can be applied only to continuous random variables
Lilliefors test • Similar to Kolmogorov test • Based on the null hypothesis that the random continuous variable is normally distributed N(m,s2), with m and s2 unknown • Performed comparing the empirical repartition function F(z1,z2,...,zn) with the one of the standardized normal distribution F(z): D* = sup | FO(z) - F(z)|
Problem of the two samples The test statistics contains a weight function Based on the test statistics: t = n1*n2 / (n1+n2)2i [F1(xi) – F2(xi)]2 Can be performed on binned variables Satisfactory for symmetric and right-skewed distribution Based on the test statistics: w2 = integral (FO(x) - FT(x))2 dF(x) The test statistics contains a weight function Can be performed on unbinnedvariables Satisfactory for symmetric and right-skewed distributions Fisz-Cramer-von Mises test Cramer-von Mises test
Anderson-Darling test • Performed on the test statistics: A2= integral { [FO(x) – FT(x)]2 / [FT(x) (1-FT(X))] } dFT(x) • Can be performed both on binnedand unbinned variables • The test statistics contains a weight function • Seems to be suitable to any data-set(Aksenov and Savageau - 2002) with any skewness (symmetric distributions, left or right skewed) • Seems to be sensitive to fat tail of distributions
Kuiper test • Based on a quantity that remains invariant for any shift or re-parameterisation • Does not work well on tails D* = max (FO(x)-FT(x)) + max (FT(x)-FO(x)) • It is useful for observation on a circle, because the value of D* does not depend on the choice of the origin. Of course, D* can also be used for data on a line
Power of the tests The power of a test is the probability of rejecting the null hypothesis correctly In terms of power: Kolmogorov-Smirnov Tests containing a weight function 2 < < • 2loses information in a test for continuous distribution by grouping the data into cells • Kac, Kiefer and Wolfowitz (1955) showed that D requires n4/5observations compared to n observations for 2 to attain the same power • Cramer-von Mises and Anderson-Darling statistics are expected to be superior to D, since they make a comparison of the two distributions all along the range of x, rather than looking for a marked difference at one point
2 design UR 1.1 The user shall be able to compare binned distributions by means of 2 test.
Unit test: 2 (1) EXAMPLE FROM PICCOLO BOOK (STATISTICS - page 711) The study concerns monthly birth and death distributions (binned data) 2 test-statistics = 15.8 Expected 2 = 15.8 Exact p-value=0.200758 Expected p-value=0.200757 Months
EXAMPLE FROM CRAMER BOOK (MATHEMATICAL METHODS OF STATISTICS - page 447) The study concerns the sex distribution of children born in Sweden in 1935 Exact p-value=0 Expected p-value=0 2 test-statistics = 123.203 Expected 2 = 123.203 Unit test: 2 (2)
UR 1.2 The user shall be able to compare binned distributions by means of Anderson- Darling test. WORK IN PROGRESS ADB design
KSG Design UR 1.3 The user shall be able to compare unbinned distributions by means of Kolmogorov-Smirnov Goodman test.
EXAMPLE FROM PICCOLO BOOK (STATISTICS - page 711) The study concerns monthly birth and death distributions (unbinned data) 2 test-statistics = 3.9 Expected 2 = 3.9 Exact p-value=0.140974 Expected p-value=0.140991 Cumulative Function Months Unit test: K-S Goodman (1)
EXAMPLE FROM LANDENNA BOOK (NONPARAMETRIC TESTS BASED ON FREQUENCIES - page 287) We consider body lengths of two independent groups of anopheles 2 test-statistics = 1.5 Expected 2 = 1.5 Exact p-value=0.472367 Expected p-value=0.472367 Body lengths Unit test: K-S Goodman (2)
KS Design UR 1.4 The user shall be able to compare unbinned distributions by means of Kolmogorov-Smirnov test.
EXAMPLE FROM http://www.physics.csbsju.edu/stats/KS-test.html The study concerns how long a bee stays near a particular tree (Redwell/Whitney) D test-statistics =0.2204 Expected D =0.2204 Cumulative Exact p-value=0.0354675 Expected p-value=0.035 Unit test: Kolmogorov-Smirnov(1)
EXAMPLE FROM LANDENNA BOOK (NONPARAMETRIC STATISTICAL METHODS - page 318-325) We consider one clinical parameter of two independent groups of patients D test-statistics = 0.65 Expected D = 0.65 Cumulative Exact p-value=2 10-19 Expected p-value=8 10-19 Unit test: Kolmogorov-Smirnov (2)
UR 1.5 The user shall be able to compare unbinned distributions by means of Anderson- Darling test. ADU Design
UR 1.6 The user shall be able to compare binned distributions by means of Cramer- Von Mises test. CVMB Design
UR 1.7 The user shall be able to compare unbinned distributions by means of Cramer- Von Mises test. CVMU Design
...and more • No time to illustrate all the algorithms and statistics details... • Other components in progress, not only GoF • PDF • Toy Monte Carlo • (L. Lista et al., INFN Napoli, BaBar) • A general purpose, open source tool for statistical data analysis • interest in HEP community: LCG, BaBar, CDF etc. • 2 talks at PHYSTAT 2003, SLAC, 8-11 September 2003
Do we need such sophisticated algorithms? ESA test beam at Bessy, Bepi Colombo mission c2 not appropriate (< 5 entries in some bins, physical information would be lost if rebinned) Alfonso Mantero, Thesis, Univ. Genova, 2002 Anderson-Darling Ac (95%) =0.752
Status and plans • b-release March 2003 • 1st (preliminary) release June 2003 • basic algorithms • unit and system tests • Recent developments • added new algorithms, improved design • Work in progress • filtering • treatment of errors (uncertainties) • In preparation • improved documentation • user examples (now use system tests as preliminary examples)
Conclusions • A lot of progress since last year’s workshop... • a lot of work, but also a lot of fun! • A group of bright, enthusiastic, hard-working young collaborators... • Ground for Geant4 Physics Book
Physics Testing Project see talk on Validation, Thursday plenary
More at IEEE-NSS, Portland, 19-25 October 2003 B. Mascialino et al., A Toolkit for statistical data analysis L. Pandola et al., Precision validation of Geant4 electromagnetic physics