Download
1 / 41
410 likes | 428 Views
Explore the attributes and distributions of populations in response to environmental factors, including climate change effects on small-mammal communities. Learn about niche modeling, invasive species probabilities, dispersion patterns, and population density dynamics.

E N D
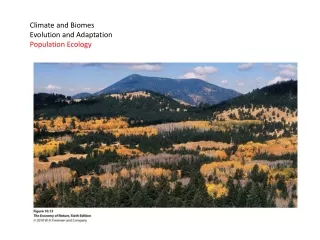
Climate and Biomes Evolution and Adaptation Population Ecology
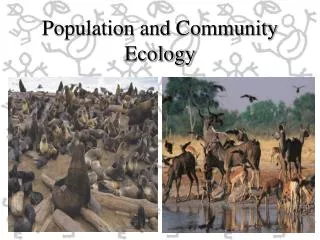
Population Ecology • Attributes of Populations • - Population: A group of potentially interbreeding organisms at the same time and place, that share a common gene pool. • - Population size : number of individuals • - Population Growth Rate: change in number over time, as a function of • (birth +immigration)- (death + emigration) • - Population density : number per unit area • - Range/distribution: geographic area over which the individuals are dispersed. • - Population Structure: • - age class structure • - sex ratio • - genetic structure • - spatial structure (pattern of how individuals are distributed through the range)
Population Ecology • Attributes of Populations • Distributions • A. Determining Factors • 1. Environmental Tolerance – the Niche Concept Fremont’s Leather flower
Population Ecology • Attributes of Populations • Distributions • A. Determining Factors • 1. Environmental Tolerance range performance Realized and fundamental niches Zones of optima, tolerance, intolerance temperature soil moisture Typically, populations have higher density under optimal conditions
Population Ecology • Attributes of Populations • Distributions • A. Determining Factors • 1. Environmental Tolerance • 2. Barriers to Dispersal
A. Determining Factors 1. Environmental Tolerance 2. Barriers to Dispersal 3. Changes thru Time: Seasonal Migration
A. Determining Factors 1. Environmental Tolerance 2. Barriers to Dispersal 3. Changes thru Time: Seasonal Migration 4. Changes thru Time: Climate Change North Sea bottom trawl data Increase in southerly species of little commercial value; decrease in abundance of commercially valuable north sea species (dogfish, ling)
A. Determining Factors 1. Environmental Tolerance 2. Barriers to Dispersal 3. Changes thru Time: Seasonal Migration 4. Changes thru Time: Climate Change Changes in elevational range cooler warmer
Craig Moritz,1,2* James L. Patton,1,2 Chris J. Conroy,1 Juan L. Parra,1,2 Gary C. White,3 Steven R. Beissinger1,4. 2008. Impact of a Century of Climate Change on Small-Mammal Communities in Yosemite National Park, USA. Science 322:261-264.
Craig Moritz,1,2* James L. Patton,1,2 Chris J. Conroy,1 Juan L. Parra,1,2 Gary C. White,3 Steven R. Beissinger1,4. 2008. Impact of a Century of Climate Change on Small-Mammal Communities in Yosemite National Park, USA. Science 322:261-264.
A. Determining Factors 1. Environmental Tolerance 2. Barriers to Dispersal 3. Changes thru Time: Seasonal Migration 4. Changes thru Time: Climate Change 5. Niche Modeling and Invasive Species
Probabilities of three Eucalyptus species being found in an area, mapped by climate and soil type.
Probabilities of three Eucalyptus species being found in an area, mapped by climate and soil type. Invaded 40 yrs ago – aquarium plant dumped into canals in Florida
Probabilities of three Eucalyptus species being found in an area, mapped by climate and soil type.
Problems: Doesn’t account for biological aspects of the environment - maybe the native range is limited by competition/predation - separated from that competitor/predator, the range may increase Water Hyacinth “Biological Control Agent” Neochetina eichhorniae
Problems: Doesn’t account for biological aspects of the environment - maybe the native range is limited by competition/predation - separated from that competitor/predator, the range may increase Doesn’t account for the possibility of adaptation gypsy moth spread 1868 – Medford, MA
A. Determining Factors B. Dispersion – how organisms in a population are spaced
B. Dispersion - Regular Low variance
B. Dispersion - Regular - intraspecific competition - allelopathy - territoriality
B. Dispersion - Clumped - patchy resource - social effects - limited dispersal High variance
B. Dispersion - Random - canopy trees, later in succession Normal distribution
B. Dispersion - Complexities Varies with type of dispersal
B. Dispersion - Complexities Varies with life-history stage
B. Dispersion - Complexities Varies with spatial scale and resource distribution
C. Population Density 1. Correlates with Niche Parameters – greatest at center of range Density of Dickcissel, a prairie songbird
C. Population Density 2. Habitat Selection Fretwell – Lucas model of habitat selection (1972)
C. Population Density 3. Maintenance of Marginal Populations Why don’t these adapt to local conditions?
D. Modeling the Spatial Structure of Populations 1. Metapopulation Model Subpopulation inhabit separate patches of the same habitat type in a “matrix” of inhospitable habitat.. - immigration causes recolonization of habitats in which population went extinct. So, rates of immigration and local extinction are critical to predicting long-term viability of population.
D. Modeling the Spatial Structure of Populations 2. Source-Sink Model Subpopulations inhabit patches of different habitat quality, so there are ‘source’ populations with surplus populations that disperse to populations in lower quality patches (‘sinks’).
D. Modeling the Spatial Structure of Populations 3. Landscape Model Subpopulations inhabit patches of different habitat quality, so there are ‘source’ populations with surplus populations that disperse to populations in lower quality patches (‘sinks’). However, the quality of the patches is ALSO affected by the surrounding matrix… alternative resources, predators, etc. And, the rate of migration between patches is also affected by the matrix between patches… with some areas acting as favorable ‘corridors’
E. Macroecology “Top-down” approach – what can the large scale patterns in abundance, density, and diversity tell us?
E. Macroecology 1. Some General Patterns - Species with high density in center of range often have large ranges
E. Macroecology 1. Some General Patterns - Species of large organisms have smaller populations
E. Macroecology 1. Some General Patterns - And of course, food limits size/density relationships
E. Macroecology 1. Some General Patterns - energy equivalency rule: pop’s of biologically similar organisms consume the same amount of energy/unit area, but process it in different ways depending on body size….LATER
E. Macroecology 2. The shapes of ranges - Abundant species have ranges running E-W; rare species have N-S ranges
E. Macroecology 2. The shapes of ranges So, if a species has an E-W range, it will probably cross many habitats; signifying that the species is an abundant generalist.
E. Macroecology 2. The shapes of ranges So, if a species has an E-W range, it will probably cross many habitats; signifying that the species is an abundant generalist. If a species has a N-S distribution, it may be a rare specialist limited to one habitat zone.
E. Macroecology 2. The shapes of ranges So, if a species has an E-W range, it will probably cross many habitats; signifying that the species is an abundant generalist. If a species has a N-S distribution, it may be a rare specialist limited to one habitat zone. An independent test would be to make predictions about Europe.
E. Macroecology 2. The shapes of ranges An independent test would be to make predictions about Europe.
E. Macroecology 2. The shapes of ranges An independent test would be to make predictions about Europe. Abundant species run N-S, and rare species run E-W, as predicted by topography and the generalist-specialist argument.