DISTRIBUTION FITTING
DISTRIBUTION FITTING. What Is Distribution Fitting?.


DISTRIBUTION FITTING
E N D
Presentation Transcript
What Is Distribution Fitting? • Distribution fitting is the procedure of selecting a statistical distribution that best fits to a data set generated by some random process. In other words, if you have some random data available, and would like to know what particular distribution can be used to describe your data, then distribution fitting is what you are looking for.
Why Is It Important To Select The Best Fitting Distribution? • Probability distributions can be viewed as a tool for dealing with uncertainty: you use distributions to perform specific calculations, and apply the results to make well-grounded business decisions. However, if you use a wrong tool, you will get wrong results. If you select and apply an inappropriate distribution (the one that doesn't fit to your data well), your subsequent calculations will be incorrect, and that will certainly result in wrong decisions. • Distribution fitting allows you to develop valid models of random processes you deal with, protecting you from potential time and money loss which can arise due to invalid model selection, and enabling you to make better business decisions.
Can't I Just Assume The Normal Distribution? • The Normal distribution has been developed more than 250 years ago, and is probably one of the oldest and frequently used distributions out there. So why not just use it? It Is Symmetric • The probability density function of the Normal distribution is symmetric about its mean value, and this distribution cannot be used to model right-skewed or left-skewed data: It Is Unbounded • The Normal distribution is defined on the entire real axis (-Infinity, +Infinity), and if the nature of your data is such that it is bounded or non-negative (can only take on positive values), then this distribution is almost certainly not a good fit: Its Shape Is Constant • The shape of the Normal distribution does not depend on the distribution parameters. Even if your data is symmetric by nature, it is possible that it is best described by one of the related models such as the Cauchy distribution or t- distribution.
Which Distribution Should I Choose? • In most cases, you can fit two or more distributions, compare the results, and select the most valid model. The "candidate" distributions you fit should be chosen depending on the nature of your probability data. For example, if you need to analyze the time between failures of technical devices, you should fit non-negative distributions such as Exponential or Weibull, since the failure time cannot be negative. • You can also apply some other identification methods based on properties of your data. For example, you can build a histogram and determine whether the data are symmetric, left-skewed, or right-skewed, and use the distributions which have the same shape.
Which Distribution Should I Choose? • To actually fit the "candidate" distributions you selected, you need to employ statistical methods allowing to estimate distribution parameters based on your sample data. • After the distributions are fitted, it is necessary to determine how well the distributions you selected fit to your data. This can be done using the specific goodness of fit tests or visually by comparing the empirical (based on sample data) and theoretical (fitted) distribution graphs. As a result, you will select the most valid model describing your data.
Exploratory Data Analysis (EDA) • EDA includes: • Descriptive statistics (numerical summaries): mean, median, range, variance, standard deviation, etc. In SPSS choose Analyze: Descriptive Statistics: Descriptives. • Kolmogorov-Smirnov & Shapiro-Wilk tests: These methods test whether one distribution (e.g. your dataset) is significantly different from another (e.g. a normal distribution) and produce a numerical answer, yes or no. Use the Shapiro-Wilk test if the sample size is between 3 and 2000 and the Kolmogorov-Smirnov test if the sample size is greater than 2000. Unfortunately, in some circumstances, both of these tests can produce misleading results, so statisticians usually prefer graphical plots to tests such as these. • Graphical methods: • histograms • stem & leaf plots • box & whisker plots • Normal probability plots: PP and QQ plots • …
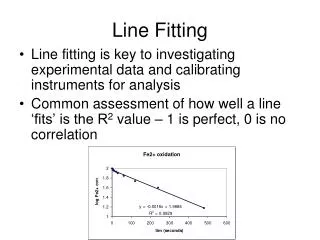
QQ Plots • The assumption of a normal model for a population of responses will be required in order to perform certain inference procedures. Histogram can be used to get an idea of the shape of a distribution. However, there are more sensitive tools for checking if the shape is close to a normal model – a Q-Q Plot. • Q-Q Plot is a plot of the percentiles (or quantiles) of a standard normal distribution (or any other specific distribution) against the corresponding percentiles of the observed data. If the observations follow approximately a normal distribution, the resulting plot should be roughly a straight line with a positive slope.
QQ Plot • The graphs below are examples for which a normal model for the response is not reasonable. 1. The Q-Q plot above left indicates the existence of two clusters of observations. 2. The Q-Q plot above right shows an example where the shape of distribution appears to be skewed right.
QQ Plot • 3. The Q-Q plot below left shows evidence of an underlying distribution that has heavier tails compared to those of a normal distribution. • The Q-Q plot below right shows evidence of an underlying distribution which is approximately normal except for one large outlier that should be further investigated.
Goodness-of-Fit Tests • The chi-square test is used to test if a sample of data come from a population with a specific distribution. • The chi-square test is defined for the hypothesis: H0: The data follow a specified distribution. Ha: The data do not follow the specified distribution. Test Statistic: For the chi-square goodness-of-fit computation for continuous data, the data are divided into k bins and the test statistic is defined as where Oi is the observed frequency andEi is the expected frequency.
Goodness-of-Fit Tests • Two values are involved, an observed value, which is the frequency of a category from a sample, and the expected frequency, which is calculated based upon the claimed distribution. • The idea is that if the observed frequency is really close to the claimed (expected) frequency, then the square of the deviations will be small. The square of the deviation is divided by the expected frequency to weight frequencies. A difference of 10 may be very significant if 12 was the expected frequency, but a difference of 10 isn't very significant at all if the expected frequency was 1200.
Goodness-of-Fit Tests • If the sum of these weighted squared deviations is small, the observed frequencies are close to the expected frequencies and there would be no reason to reject the claim that it came from that distribution. Only when the sum is large there is a reason to question the distribution. Therefore, the chi-square goodness-of-fit test is always a right tail test.
Assumptions • The data are obtained from a random sample • The expected frequency of each category must be at least 5. This goes back to the requirement that the data be normally distributed. You're simulating a multinomial experiment (using a discrete distribution) with the goodness-of-fit test (and a continuous distribution), and if each expected frequency is at least five then you can use the normal distribution to approximate (much like the binomial).
Properties of the Goodness-of-Fit Test • The degrees of freedom = number of categories (or classes) – number of parameters estimated from data -1 • It is always a right tail test. • It has a chi-square distribution. • The value of the test statistic doesn't change if the order of the categories is switched.
Prussian Cavalry getting kicked in the head • X: the number of fatalities per regiment/year in the Prussian cavalry due to horse kicks. It seems that the Poisson distribution is appropriate. Is this true? H0: Deaths due to kicking followed a Poisson distribution. HA: Kicking deaths do not have a random Poisson distribution.
Prussian Cavalry getting kicked in the head • To test this with a goodness of fit test, we must first know how to generate the null distribution. The problem is that we don't have an a priori expectation for the rate of horse-kick fatalities, and we must therefore estimate the rate from the data itself. The average number of kicking deaths per year is : [109 (0) + 65 (1) + 22 (2) + 3 ( 3) + 1 (4)] / 200 = 0.61 deaths/year • So we can use this as our estimate of the rate of kicking fatalities.
Prussian Cavalry getting kicked in the head • From this we can calculate the expected frequencies of the numbers of deaths per year, given the Poisson distribution:
Prussian Cavalry getting kicked in the head • We then must combine across classes to ensure E.I. > 4: • So now there are 4 classes and we have estimated one parameter (the average rate) from the data, we have 4 - 1 - 1 = 2 df. • We can calculate that 2 = 0.415, and the critical value of 2 with 2 df and alpha = 5% is • 20.05,2 = 5.991, we are not in the tail of the distribution, and we cannot reject the null hypothesis that the deaths are from Poisson. In fact the match to the Poisson distribution is remarkably good.
One-Sample Kolmogorov-Smirnov Goodness-of-Fit Test • The Kolmogorov-Smirnov Z test, also called the Kolmogorov-Smirnov D test, is a goodness-of-fit test which tests whether a given distribution is not significantly different from one hypothesized (ex., on the basis of the assumption of a normal distribution). It is a more powerful alternative to chi-square goodness-of-fit tests when its assumptions are met.
One-Sample Kolmogorov-Smirnov Goodness-of-Fit Test • As illustrated in the SPSS dialog for the Kolmogorov-Smirnov test, SPSS supports the following hypothetical distributions: uniform, normal, Poisson, and exponential.
One-Sample Kolmogorov-Smirnov Goodness-of-Fit Test • In the SPSS output example below, the sample variable Educational Level is tested against a hypothetical normal distribution. The bar chart, not part of the K-S module, shows the distribution of Educational Level. The K-S test tests if it may reasonably be assumed that this sample distribution reflects an underlying normal distribution.
K-S Goodness-of-Fit Test The two-tailed significance of the test statistic is very small (.000), meaning it is significant. A finding of significance, as here, means Educational Level may not be assumed to come from a normal distribution with the given mean and standard deviation. It might still be that sample subgroups (ex., females), with different means and standard deviations, might test as being plausibly from a normal distribution, but that is not tested here.