Download
1 / 33
330 likes | 356 Views
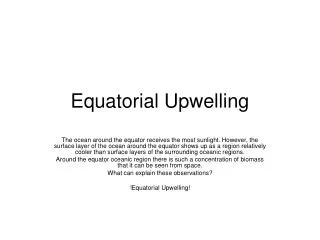
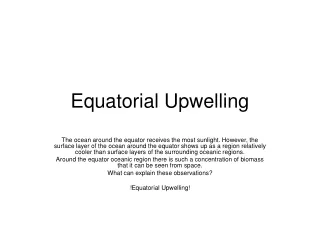
This study examines the effects of stronger upwelling on eutrophication, biomass, and trophic transfer efficiency in pelagic species. It also explores the influence of climate oscillations and time scales on the vulnerability and response of these species. The findings highlight the impact of temperature, nutrients, and food availability on primary production and higher trophic levels.

E N D
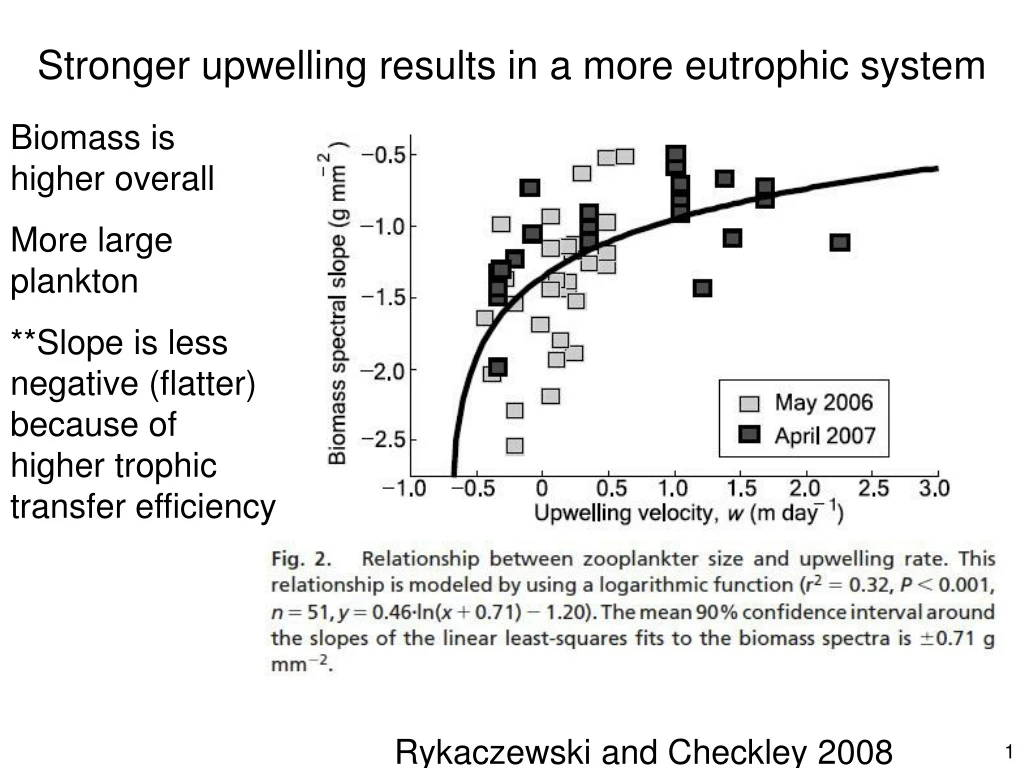
Stronger upwelling results in a more eutrophic system Biomass is higher overall More large plankton **Slope is less negative (flatter) because of higher trophic transfer efficiency Rykaczewski and Checkley 2008
Time scales of physics vs. biology • ENSO effects on biology • Pacific Decadal Oscillation (PDO)
The problem: multiple time scales of variability years Humans century decades centuries
Generation time: Doubling time for unicellular organisms, or time to first reproduction for animals • Dominant environmental forcing: Typically the physical process responsible for the greatest amount of variability in a biological response
Generation times affect vulnerability Tuna Sardine Anchovy Salmon Krill Copepods Jellyfish Phytoplankton Bacteria 1 year 1 day 1 hour 1 week 10 years 15 years 5 years 1 month 20 years • Life Spans • # Reproductive years • Body size • Swimming speed • Energy reserves Time scales
Generation times affect vulnerability Tuna Sardine Anchovy Salmon Krill Copepods Jellyfish Phytoplankton Bacteria 1 year 1 day 1 hour 1 week 10 years 15 years 5 years 1 month 20 years Seasonal Cycles • Life Spans • # Reproductive years • Body size • Swimming speed • Energy reserves Time scales
Generation times affect vulnerability Tuna Sardine Anchovy Salmon Krill Copepods Jellyfish Phytoplankton Bacteria 1 year 1 day 1 hour 1 week 10 years 15 years 5 years 1 month 20 years Seasonal Cycles ENSO Duration ENSO Frequency • Life Spans • # Reproductive years • Body size • Swimming speed • Energy reserves Time scales
Generation times affect vulnerability Tuna Sardine Anchovy Salmon Krill Copepods Jellyfish Phytoplankton Bacteria 1 year 1 day 1 hour 1 week 10 years 15 years 5 years 1 month 20 years Seasonal Cycles ENSO Duration ENSO Frequency PDO +/- Duration • Life Spans • # Reproductive years • Body size • Swimming speed • Energy reserves Time scales
Main effects of climate oscillations on pelagic species • Temperature/nutrients affect primary production • Food availability affects higher trophic levels • Temperature affects rates of growth or survival (all trophic levels) • Larger/faster species move to find preferred temperature, causing range shifts
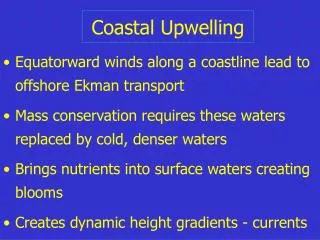
Top: normal Bottom: El Niño condition • Eastern boundary • Shallow thermocline • Cold, nutrient-rich water • Mixing depth shallower than critical depth • High NPP • Deep thermocline • Warm, nutrient-poor water • Mixing depth not as much shallower than critical depth • Lower NPP Normal El Nino Open University, 1998
Major episodes occur every 3-7 years and last 9-18 months Temperature anomaly
The most notable El Niño events #1: 1997-1998 #2: 2015-2016 #3: 1982-1983 ‘87-’88 ‘72-’73 Note the MEI scale is reversed relative to the SOI (Southern Oscillation Index), so El Niño is on top, La Niña on bottom
Jan. 1998 El Niño July 1998 La Niña
Weak upwelling Strong upwelling In El Niño conditions, upwelling is weaker, and the coastal jet (warm water) reconnects with the coast farther north near CA. In La Niña conditions, upwelling is stronger, and the coastal jet (warm water) reconnects with the coast farther south near Baja. El Niño year looks more like this La Niña year looks more like this
Spring SST distribution in California Current Normal year El Niño year Shaded area = 16 to 17 oC
Zooplankton time series from California Current Biomass of Zooplankton >500 μm (from CalCOFI) Lavaniegos and Ohman 2003
ENSO lower biomass of large zooplankton Major El Niños (warm) Major La Niñas (cool) Biomass of Zooplankton >500 μm California Current -El Niño reduces upwelling -Lower nutrients reduced primary production -Low primary production low zooplankton biomass etc. Lavaniegos and Ohman 2003
California Current krill community - response to SST is species-specific Jaime Gomez ocean.stanford.edu/blsaenz El Niños (warm) La Niñas (cool) Nyctiphanes simplex (subtropical) Life span <1 year Abundance anomalies Euphausia pacifica (cool water, widespread) Life span ~2 years Brinton & Townsend 2003
-Anchovy are more negatively affected by El Niños.-Compared to sardines, anchovy have shorter life span, prefer cooler water, and eat larger plankton. -ENSO effects are small relative to long-term variability. Sardine and anchovy landings in Peru Major El Niños Major El Niños Major El Niños Chavez et al. 2003
Pacific Decadal Oscillation (PDO) ~15 to 30 year cycle + - Positive PDO pattern Negative PDO pattern • The PDO Index is a spatial average of winter monthly sea surface temperature (SST) anomaly of the Pacific Ocean north of 20o N. The global average anomaly is subtracted to account for global warming (Mantua, 2000). • Highly correlated with temperature in California Current
El Niño = ENSO warm event La Niña = ENSO cool event Pacific Decadal Oscillation (PDO) Positive/warm PDO phase Negative/cool PDO phase ENSO events: 6-18 month duration 2-8 year frequency ENSO index is based on sea level but has characteristic temperature pattern (Walker circulation affects location and extent of Pacific warm pool) PDO cycle: 15-30 year phase (low-frequency oscillation) PDO index is based on patterns of temperature anomaly but has sea level patterns like those of ENSO
Sea Surface Temperature Anomalies El Niño, +PDO Pattern La Niña, -PDO Pattern -ENSO and PDO index both change continuously. -Their patterns are additive.
PDO alternates between long positive (warm) and negative (cool) phasesc warm cool warm
Unclear where current phase is headed… warm cool warm ? developing...
Three most intense El Niños occurred during a warm PDO phase https://www.esr.org/pdo_index.html
- PDO (cool) + PDO (warm) Major El Niños (warm) Major La Niñas (cool) Biomass of Zooplankton >500 μm California Current -Zooplankton biomass is lower during +PDO warm phases -Effects of warm PDO and warm El Niño events are additive Lavaniegos and Ohman 2003
Some krill track PDO better than ENSO - PDO (cool) + PDO (warm) Jaime Gomez ocean.stanford.edu/blsaenz El Niños (warm) La Niñas (cool) Nyctiphanes simplex (subtropical) Life span <1 year Abundance anomalies Euphausia pacifica (widespread) Life span ~2 years Brinton & Townsend 2003
+PDO (warm) is sardine regime -PDO (cool) is anchovy regime (anchovies are also affected by ENSO cycle) -PDO (cool) +PDO (warm)
ENSO vs. PDO effects on biology • El Niño/La Niña and Pacific Decadal Oscillation have similar “fingerprints” but different time scales • Short-lived species more responsive to ENSO, longer-lived species more responsive to PDO • BUT effects on abundance and distribution of zooplankton and fish are species-specific • Tropical species less likely to be negatively impacted by El Niño or +PDO
On top of these cycles there is a global warming trend (Theme 5 in Nov./Dec.).