Download
1 / 14
140 likes | 155 Views
In this activity, we explore logarithmic equations and the relationship between walking speed and population. We also learn about inverse functions and their properties.

E N D
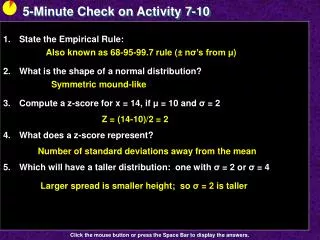
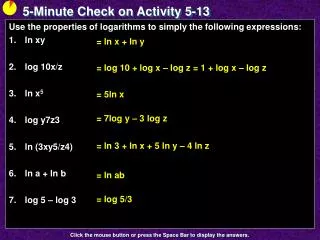
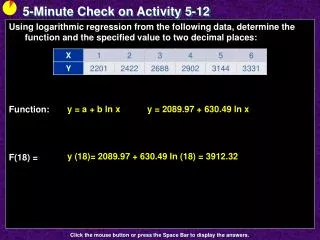
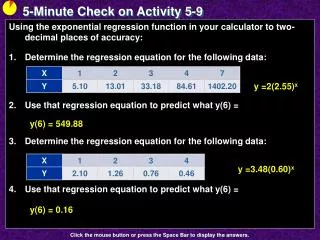
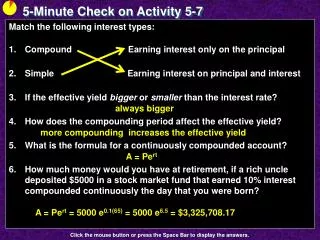
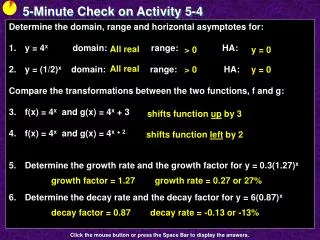
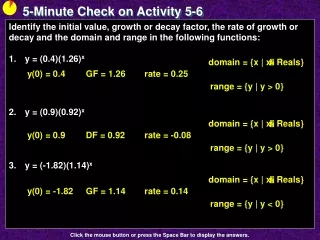
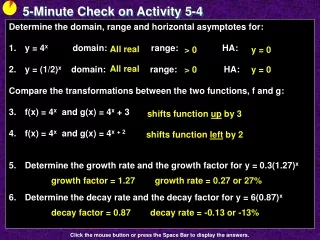
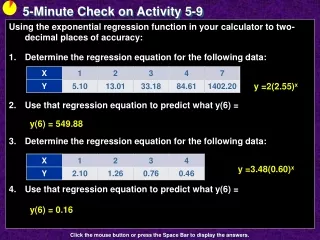
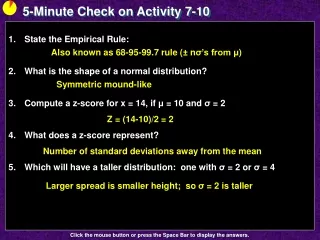
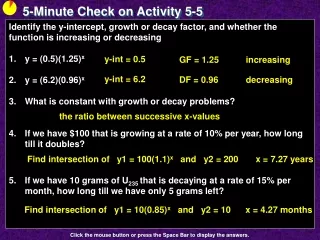
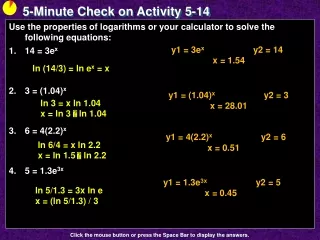
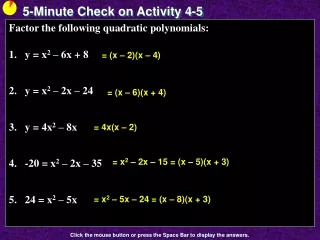
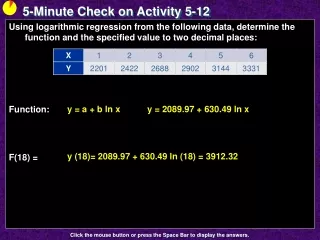
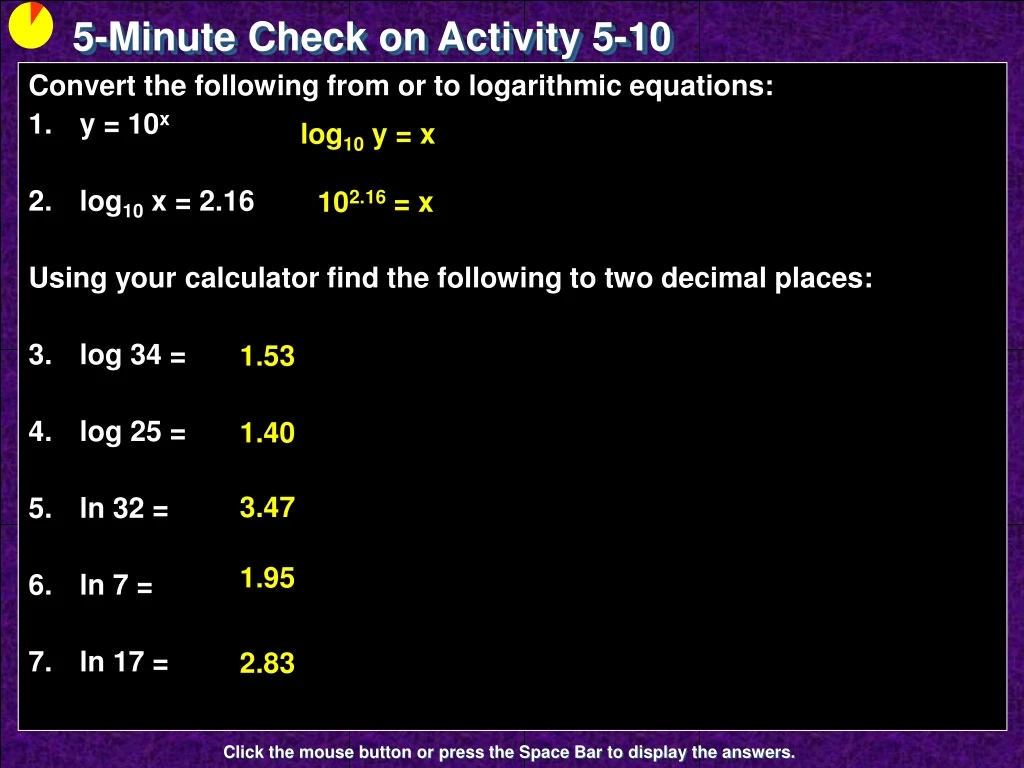
5-Minute Check on Activity 5-10 Convert the following from or to logarithmic equations: y = 10x log10 x = 2.16 Using your calculator find the following to two decimal places: log 34 = log 25 = ln 32 = ln7 = ln 17 = log10 y = x 102.16 = x 1.53 1.40 3.47 1.95 2.83 Click the mouse button or press the Space Bar to display the answers.
Activity 5 -11 Bay Street, Toronto, Canada 5/27/2005 Walking Speed of Pedestrians
Objectives • Determine the inverse of the exponential function • Identify the properties of the graph of a logarithmic function • Graph the natural logarithmic function using transformations
Vocabulary • Logarithmic function – defined by the inverse function of an exponential function to the base, b • Inverse functions – interchange the domain and range of the original function. The graph of an inverse function is the reflection of the original function about the line y = x. You determine the inverse function by switching x and y and solve the new equation for y. • Vertical asymptote – a vertical line that the function approaches but never reaches (usually a restricted value in the domain)
Activity On a recent visit to Boston, you notice that people seem rushed as the move about the city. Upon returning to school, you mention this observation to your psychology teacher. The instructor refers you to a psychology study that investigates the relationship between the average walking speed of pedestrians and the population of the city. Does the data appear to be linear? Does the data appear to be exponential? No; rate of change is not constant No; rate of change is not increasing as x increases
Activity cont The study cites statistics presented in the graph. Data is logarithmic
Common Logarithmic Function The logarithmic function base b is defined by y = logb x where b is the base (b > 0 and b ≠ 1) x is the power of the base, b and y is the exponent needed on b to obtain x Properties of f(x) = log x (common log) • Base is 10 • Domain of x is set of all positive numbers (x > 0) • Range of y is set of all real numbers • f(x) is inverse of g(x) = 10x
Natural Logarithmic Functions Properties of f(x) = ln x • Base is e (natural number ≈ 2.718281828) • Domain of x is set of all positive numbers (x > 0) • Range of y is set of all real numbers • f(x) is inverse of g(x) = ex
y x Natural Logarithmic Graph Fill in the table and graph y = ln x
Inverse Functions Inverse functions interchange the domain and range of the original function. Also the graph of the inverse function is a reflection of the original function about the line y = x. To get the inverse function, simply switch the x and y values in the equation and solve the new equation for y. Fill in the table below using your calculator -2 -1 0 1 2 0.01 0.1 1 10 100
Inverse Functions Examples x = 2y – 3 x + 3 = 2y ½ x + 3/2 = y Find the inverse of the following functions • y = 2x – 3 • y = x2 • y = 5x x = y2 √x = y x = 5y Y = log5 x
Vertical Asymptotes A vertical asymptote is a vertical line, x = a, that the graph of a function becomes very close to but never touches. As the x-values get closer and closer to a, the y-values get larger and larger in magnitude (approaching positive or negative infinity, ±∞). These are usually at restricted values (division by zero or negatives under the radical) in the domain.
Logarithmic Transformations Compared to y = ln x, describe the graphic relationship between its graph and the following graphs: • y = -ln x • y = ln (x + 3) • y = ln (-x) • y = ln x + 3 • y = 2 ln x • y = 3 – 2 ln x Outside: Reflection across x-axis Inside: Shift left 3 units Inside: Reflection across y-axis Outside: Shift up 3 units Outside: Vertical stretch by 2 Outside: Vertical stretch by 2; reflected across x-axis and shifted up by 3
Summary and Homework • Summary • Properties of the function y = log x: • Domain is x > 0 • Range is all real numbers • Is the inverse of the function x = 10y • Graph of the function y = logb x or y = ln x: • is increasing for all x > 0 • x-intercept of (1,0) and no y-intercept • x = 0 (y-axis) is a vertical asymptote • is continuous for x > 0 • Inverse functions are determined by interchanging x and y variables • Homework • pg 640-43; problems 1, 3-5