Download
1 / 27
270 likes | 443 Views
TABLE AND GRAPH GUIDELINES. Table rules . All scientific tables should fulfill the following requirements. 1. Designing a table to record results is part of the planning phase of an experiment or procedure. 2. A table will allow the presentation and analysis of the collected data.

E N D
TABLE AND GRAPH GUIDELINES Biology is fun!
Table rules All scientific tables should fulfill the following requirements. Biology is fun!
1. Designing a table to record results is part of the planning phase of an experiment or procedure. • 2. A table will allow the presentation and analysis of the collected data. • 3. Tables may include raw data, transformed data, or both. Biology is fun!
4. All tables must have an accurate and descriptive title. It is suggested that the title include both the independent and dependent variables. • 5. Tables are comprised of columns and rows. • 6. The independent variable (manipulated variable) should be represented in the left column. Biology is fun!
Glucose levels related to time Biology is fun!
7. Control values, if present, should be placed at the beginning of the table, top of column and first row. • 8. Each row should show a different experimental treatment, organism, sampling site, etc. Biology is fun!
9. The headings of row and columns should identify each set of data and should include the proper unit of measurement (if not included with each individual measurement). Biology is fun!
10. Show values in the table to the level of significance allowable by the used measuring device. All values in the table should have the same number of decimal places. This includes raw values and transformed values. Biology is fun!
11. Columns that need to be compared should be placed adjacent to one another. • 12. Lines should be present to separate columns and rows, and they must be straight, not hand-drawn. Biology is fun!
13. Levels of uncertainty should be expressed in the heading for each column or at the bottom of the table. If expressed at the bottom of the table, the uncertainty need be noted only once. Examples: 10.0 mm ± 0.1 mm or 25 degrees C ± 2 degrees. Biology is fun!
14. For units, use negative exponents in place of denominators. Examples: g day¯¹ or km hr¯¹. Biology is fun!
Example of a properly constructed table Biology is fun!
General guidelines for graphing Often, the goal of an experiment is to find the relationship between two variables (the independent and the dependent variable). Graphing is a useful way to visualize and describe these relationships. The following guidelines should be followed whenever constructing a graph in this class. Biology is fun!
1. All graphs must have a title. The title should be concise and explanatory of both variables represented. If more than one graph is being produced in a report, they should be numbered consecutively. Biology is fun!
2. All graphs must be produced on graph paper (should have at least 10 squares per inch) or by way of some sort of computer program. Microsoft Excel is a common program used for graph production. If the graph is to be produced by hand, a straight edge must be used for all axes’ lines. Axes drawn free-hand will result in loss of points. Pen should be used for graph construction as this provides a higher degree of permanency. Biology is fun!
3. The minimum size of a graph should be one half of a page. Certainly, a whole page may be used. • 4. It is suggested that you tabulate all data to be graphed before beginning. Biology is fun!
5. Use the x-axis for the independent variable and the y-axis for the dependent variable. Select divisions on the axes which are easy to read. The labeled numbers most likely will be whole numbers. For greater accuracy, select scales so that the graph nearly fills the page. Biology is fun!
6. Decide the limits of the graph (maximum and minimum values). The lower left corner of the graph does not have to represent zero on either axis unless you have data in this region. A break in an axis allows economical use of space if there are no data in the “broken” area. Biology is fun!
7. Label both axes with both quantity and units. Uncertainties must be stated if they exist. If the table from which the graph is being produced has uncertainties, so must the graph. Biology is fun!
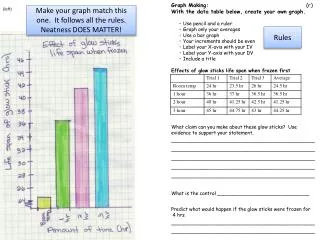
8. Data points are at first marked with a small mark. Pencil may be used before being inked for permanency. Draw a circle around the point or darken the point with pen to make it more visible. Outlier points (those points rather far outside the majority of the gathered data) should be given in the raw data table, but may be excluded from processing (graphs) and analysis. Biology is fun!
9. A smooth curve should be drawn through the points. The curve should pass as close as possible to each of the points but should not be connected point-to-point. (Data may be irregular, but nature rarely is). If the relationship appears to be linear, the smooth curve should be a straight (ruler produced) line. This type of line is often called a trend line. If the line is extended beyond the range of the measured values, this extension should be indicated by a dashed rather than a solid line. Biology is fun!
10. Measures of spread around a plotted mean value can be shown on a graph by means of error bars, . The error bars most often indicate standard deviation for the mean plotted. Error bars may also indicate 95% confidence intervals or the range of the data. These error bars involving standard deviation are easily determined when using the 5 x 5 experimental model. Biology is fun!
11. More than one set of data may be represented on a graph. If this is the case a key must be presented for easy identification. This information may be presented in the title or in a legend. • 12. Website for mean and standard deviation calculation: • http://easycalculation.com/statistics/standard-deviation.php Biology is fun!
Biological drawings • 1. Draw with a pencil on unlined paper. • 2. Center the drawing on the page. • 3. Drawing should be near one-half page in size. • 4. Drawing should be of what you actually see. Idealized drawings should be avoided. • 5. Proportions should be accurate. Use a ruler when possible. Biology is fun!
6. All parts must be labeled accurately: • A. Keep label lines horizontal • B. Label the drawing with a title • C. Show magnification factor or provide a scale • D. Name structures • E. If living, label any movements visible Biology is fun!
The end. Biology is fun!