Download
1 / 20
200 likes | 444 Views
Fish Processing Industry in the EU. Jarno Virtanen, Jordi Guillen. IPSC - Institute for the Protection and Security of the Citizen Joint Research Centre European Commission http://ipsc.jrc.ec.europa.eu/ http://www.jrc.ec.europa.eu/. FISHREG Group at JRC.

E N D
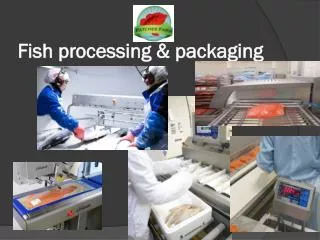
Fish Processing Industry in the EU Jarno Virtanen, Jordi Guillen IPSC - Institute for the Protection and Security of the Citizen Joint Research Centre European Commission http://ipsc.jrc.ec.europa.eu/ http://www.jrc.ec.europa.eu/
FISHREG Group at JRC Joint Research Centre (JRC) of the European Commission The Joint Research Centre is a research based policy support organisation and an integral part of the European Commission. The JRC is providing the scientific advice and technical know-how to support a wide range of EU policies. The FISHREG action inside the Maritime Affairs Unit Supports the Common Fisheries Policy and Directorate General MARE in: Fisheries management (coordination and Secretariat of the STECF Scientific Committee, data collection in the framework of DCR/DCF), Fisheries enforcement (through the development of technologies like satellite remote sensing, exchange of control data, genetics, data analyses) Scientific research including modelling, collaborative research projects
The 2009 Processing industry report STECF subgroup meeting (SGECA-09-03) to examine the structure and performance of the EU processing industry The report is the first attempt to compile national statistics and give an overview on the performance of the fish processing industry in the EU. This report is based on official data from the MS collected under the Data Collection Regulation (DCR): Covers 22 coastal EU Member States Economic data for fishing, aquaculture and processing industry The report can be downloaded from the FISHREG webpage: https://fishreg.jrc.ec.europa.eu/home
The 2009 report on fish processing Overview on the data coverage and quality. Detailed economic and structural overview of the processing sector by country. Short overview at the EU-level using indicators from the national chapters. Description of trends and drivers of change. Possibilities for more in-depth economic analyses.
Key Figures for 2007 Firms: 3 454 companies Employment: 114 121 employees* (FTE) Turnover: 25 386 Million Euros Gross Value Added: 4 504 Million Euros Profits: 1 229 Million Euros (only 15 countries) Comparing to the Fishing Fleets performance (AER): Employment: 143 000 employees - Turnover: 7 668 MEuros GVA: 3 354 MEuros - Profits: 913 MEuros
Conclusions Structure of EU fish processing sector is very heterogeneous in nature within and between countries Size (from family businesses to large processing plants), Species, geographical areas and processing methods, Origin of the raw materials (landings, imports or aquaculture). Profitability and productivity varies between member states Margins are very low. The operating costs represent more than 90% of the income. Raw materials are the major cost item of the operating costs. Data availability / quality Not all necessary data at the required level of disaggregation is collected/requested, Not all requested data is submitted / available Data quality to be assessed
Thank you! jarno.virtanen@jrc.ec.europa.eu