Download
1 / 33
330 likes | 427 Views
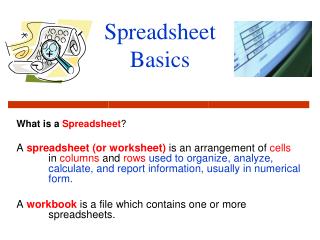
Spreadsheet Techniques for Data Processing Part 1 - Basics. Prepared by Dr David Conochie. What is a Spreadsheet?. Data is arranged in 2D or 3D matrix of cells (rows x columns x worksheets) Each cell may be of one of the following 4 types A value (numeric data)

E N D
Spreadsheet Techniques for Data ProcessingPart 1 - Basics Prepared by Dr David Conochie
What is a Spreadsheet? Data is arranged in 2D or 3D matrix of cells • (rows x columns x worksheets) Each cell may be of one of the following 4 types • A value (numeric data) • A formula ( defines the value of the cell in terms of other cells and constants. The cell contains the formula and displays the current value) • A label (text data or blank) • A hyperlink Each cell may have additional properties • Formatting of font, background and border • A comment attached • Protection • A variable name associated with the cell
Formulae (i) Use “=“ to start the formula, then type in cell reference or click on cell. = ((C12) * (J17)) – 29.3 Use operators + - / * ^ : , before adding next cell reference = ((C$12) * ($J$17) – 29.3 Use $ signs to make cell references absolute Use functions = sum(c1:c12, c19:c27) • a colon is used to define a range between and including two cells • a comma is used to separate ranges in the summation. • ranges can be typed in, or drag the cursor across a range • select multiple ranges by holding down the cntrl key. • complete the function with a right bracket.
Formulae (ii) • Exponents and Logarithms = cell reference ^2 is the square of the value = log(cell reference, base) is log base 10 as default = ln (cell reference) is natural log • Row and Column Insertion • Insert rows within a range and the formula will include your new data. • Insert row at the end of a range and the formula will not change • Be very careful and use audit tools!
Cell References in Formulae Cell references may be of the following types • Relative reference (C1) • If you copy a cell with formula entry with relative references to a row 3 rows down, all the row number references will increment by 3 rows, thus (C1) becomes (C4). • Absolute reference ($C$1), (C$1), ($C1) • The absolute reference allows you to lock a row or column reference so that the row or column value does not change during copying. Eg (C$1) stays as (C$1) when you copy it. • Range name ( e.g. “density”) • Cell references as rows and columns carry little information and complex formulae become rather cryptic. • Use Insert Name Define to give a meaningful names to a cell or range of cells. A name is an absolute reference. Caution: a wrong cross reference or a damaged formula cell can give you erroneous results!
Layout Adopt a tidy layout Data Input Table Title Physical data and constants Table with column headers
Cell Formula and Auditing Tools =$E$4*Gas_Constant*$E$7/A14 Precedent | Dependent | Erase Auditing Toolbar
Auditing Tools Auditing tools are a simple way to check the integrity of your spreadsheet. • Display the auditing toolbar (View \Toolbars \ Formula auditing) • Understand the concepts • Precedent cell (your current cell takes it as an input value) • Dependent cell (the current value of the current cell is used by the dependent cell) • Dependences are shown as blue arrows, and may put a blue box around a range. • Auditing tools pick up common errors • Data cells not being used (forgot to include them in the formula) • Cells absolute and relative references wrong • Omission of added lines from summation formulae. • References to empty cells • A double click on the precedent icon shows two levels of precedents.
Formatting Tasks • Tools \ Options \ Gridlines allows you to switch display of gridlines on or off. • Select a group of cells, then Format \ Cells \ Border allows you to construct the borders you want. • Adopt a convention for your data entry cells (pale yellow background) and one for your formula cells which you don’t want overwritten (eg pale grey background) • Display an appropriate number of significant figures (format cells number number format). • If your cell displays ##### make the column wider, the font smaller, or reduce the number of significant figures. • If you need a heading across several columns, select the cells then use format cells center across selection. • You can custom format numbers eg “pressure” ###.# “atm”
Formatting Tasks • Insert comments to help remind you or the user what you did or need to do. (Tools \ options \ view allows you to switch comments on, off, or to display as a red corner in the cell) • Take time to put enough information on your spreadsheet to identify your organisation, the author, the function of the spreadsheet, the date, the revision # etc. • Likewise format the printing page with meaningful header, footer (filename, date, author etc). Use file, page setup, header/footer, custom. Adjust the font size to 8 point. • Select cell range to print, then use file \ print area \ set print area to lock in a given range, OR use print \ preview \ selection. • You can scale your printed page using file page setup, page, then select fit to 1 page wide by 1 page tall, OR set the magnification.
How do spreadsheets work? A solver automatically works through the spreadsheet row by row, cell by cell, then sheet by sheet • Each time you change a value, the spreadsheet recalculates. • Cell references in formulae usually take input from earlier in the sheet but there is usually no constraint restricting formulae from where input data is taken. • Recalculation is repeated in an iterative manner until cells do not change more than a predetermined amount (say 1 in 1000) or a maximum number of iterations has been reached. • Cells cannot refer to each other in a circular reference – Excel will tell you immediately if you try to do this. • During spreadsheet construction Tools \ Options \ Calculation can be used to set manual recalculation if spreadsheets are big and slow (seldom used and a big trap).
Help Systems Tip: To find out what a description in a dialog box means, click on ? and then point to the description
Learning the features • Learn as you go – use the help system, and ask others. • Invest some time to explore features when you are not under pressure. • Invest time in formatting. • Check your results – spreadsheets can be dangerous if you are not careful. • Save your work regularly, particularly before doing operations you are not sure about. • Use the undo command. • Build a tidy layout and use auditing tools to check integrity of what you build. • Be very wary of spreadsheets built by others – check the formulae and audit them yourself. • Be wary of damaged spreadsheets – your own and others.
What are Spreadsheets used for? Simple data processing and presentation • Accounting data (rows and column addition) • Business analysis and financial modelling • Marketing data analysis • Plotting data logger output • Presentation of data from simulations Modelling • Use simple correlations to prepare charts • Flowsheets • Mass and energy balances Design calculations • Use input parameters, physical constants and correlations Production decision support • Linking order book to production schedules
Data Processing Spreadsheets are ideal for processing tabulated data. • Presentation of data in formatted tables • Calculation of averages, totals, standard deviation • Charting data for presentation • Single parameter data (height of students in class) is presented a bar chart. • Correlated data (fuel consumption, car speed) is presented as an X-Y chart. • Excel offers the bar chart as the default, but engineers and scientists mostly use X-Y charts.
Charting Data Insert , Chart, X-Y (Scatter), then select the style • Points only • Smoothed line (beware!) • Lines connecting points Insert chart as a new sheet
Improving the Chart It is necessary to spend time to change some of the features of the standard chart prepared by the chart wizard. • Increase line thickness • Increase font size in captions and scales • Switch off autoscale and set appropriate scales • Gridlines set to light gray (right mouse click) • Remove dark background to chart • Minimise decimal places in chart scales • Switch on minor tick marks and set interval • Add captions that provide information about your data • Check axis labels and titles • Relocate legend
Tips for Chart Editing • The last command can be repeated with function key F4. • Right mouse click brings up formatting options for an object. • Shift key allows several object to be selected. • Cycle through objects on the chart with the arrow up key. • Alt Tab allows you to cycle through open programs. • Add trendline allows a statistical fit to the data. • Smoothed lines for noisy data often give meaningless curves. • Check proportions of chart – avoid skinny charts. • Change color of any yellow lines • Shift+Print Screen copies the screen image to the clipboard
Assignment EM1 is available on Eng Mgt website Prepare a quality chart starting from a given data set.
More Tips for Chart Editing • Chart options provides access to editing many of the chart features. • A second Y axis with a different scale can be added (format \ data series \ plot on second Y axis). • More data can be added to a chart, but save your file first as this is not always predictable. • Edit the range of the data set by selecting the data points on the chart, then editing the range in the command line. • Legends can be edited in the command line. • Never attempt to edit an Excel chart that has been pasted into Word. • If you wish a chart background, use a very light gray with shading light in the center to darker at perimeter. • Dark blue text and line are excellent for charts.
Spreadsheet Techniques for Data ProcessingPart 2 - Advanced Engineering and Management 2006 Prepared by Dr David Conochie
Alternatives to Spreadsheets • Spreadsheets (good for simple data manipulation) • Excel • Quattro Pro, Lotus 123, Visi Calc • Programming languages (good for logic, rigor and documentation) • Fortran / Visual Basic • Mathematical Packages (good for models, differential equations etc • Matlab • Statistical packages (good for statistical analysis on large data sets) • SPSS • Statistica • Graphics Packages (good for complex or unusual 2D and 3D charts) • Deltagraph spreadsheets now can do most of these functions quite well.
More Complex Functions • use Insert function then select a category of function, • find the function which you need eg financial, NPV is net present value • use the help function and the examples to see how the function requires its data and how it will use that data.
Logic Functions You can build logic into your spreadsheet functions but use them sparingly. Logic functions are typically used to • avoid !DIV0 errors • switch on error flags if data is outside a range • to switch on sections of formulae if options are selected. If you have much logic in your application, use the Visual Basic add-in in Excel.
Scenarios Often we have the same spreadsheet which can be used with different sets of data which we want to be able to recall. Options: • Use multiple sheets in a workbook • Use a lookup table of data • Use scenarios (Tools Scenarios Add) In a scenario, the values for a range or selection of cells is given a case or scenario name. The values in the cells can then be changed, and a new case or scenario name is given. You can then switch between scenarios while using the same spreadsheet. Key advantage: you use a single spreadsheet to process lots of cases, so if you update the spreadsheet calculations you only need do it once. Cell Limit: about 30 cells max in the scenario.
Cell and Worksheet Protection If you want to build a robust spreadsheet for use by others you can protect cells, the worksheet or the workbook. • Use Tools, Protection, Protect Sheet or Workbook. • Cell protection has no effect until you protect the worksheet.
Macros and Visual Basic If you wish to design a spreadsheet to process data on numerous occasions, you can use a macro. Example: build a spreadsheet to process data from the strain gauges on the cantilever beam and produce a chart. Work out, or have a trial of the sequence you wish to reproduce. Switch on tools, macro, record new macro and give your macro a name. Go through the sequence, then stop the macro. Use alt f11 to switch to visual basic. Under the heading “modules” you will find the visual basic commands for your macro. It is possible to edit these macros, and to write them in VB without using the record function.
Visual Basic Macro Example ' PAGE CONTAINS ' MAIN SOLVER MACRO ' NAVIGATION BUTTONS ' Option Explicit ' Sub macro1() Application.Run Macro:="Mass_Bal_Model" ' OK and SOLVE FLAGS ' The following two lines are used to reset a counter in the spreadsheet following solve being pressed. This system was designed to avoid the changing of spreadsheet cells without the solver being run. ' Warns to solve before reading results which would have been unsolved ' Application.ScreenUpdating = True Sheets("VIU Model ").Cells(89, 7) = 0 Sheets("VIU Model ").Cells(89, 7) = 1 ' Application.DisplayStatusBar = False ' Expiry date is located in Mass Balance Model in Module5 ' End Sub'
Visual Basic Function Example Function Enthalpy_Solid_Iron(Temp As Double) ' Function for the heat capacity of solid iron: ' Inputs... ' Temp Temperature Kelvins ' Outputs... ' Enthalpy_solid_iron Ht-H298 kJ/kg Enthalpy_Solid_Iron = (8.873 * (Temp - 298) + 0.5 * 0.001474 * (Temp ^ 2 - 298 ^ 2) _ - 0 * (1 / Temp - 1 / 298) + 1 / 3 * 0 * (Temp ^ 3 - 298 ^ 3) _ - 56.92 * 2 * (Temp ^ 0.5 - 298 ^ 0.5)) _ * 4.1868 / 55.85 If Temp > 1058 Then Enthalpy_Solid_Iron = Enthalpy_Solid_Iron + 1000 * 1.22 * 4.1868 / 55.85 Else End If If Temp > 1187 Then Enthalpy_Solid_Iron = Enthalpy_Solid_Iron + 1000 * 0.16 * 4.1868 / 55.85 Else End If End Function
Visual Basic – Spreadsheet Data Transfer VB Variable Sheet Reference Cell Reference ' Bring in unit costs into model. Electricity_unit_cost = Sheets("Unit_costs").Cells(24, 4) Electrode_unit_cost = Sheets("Unit_costs").Cells(25, 4) Lime_flux_unit_cost = Sheets("Unit_costs").Cells(26, 4) Coal_unit_cost = Sheets("Unit_costs").Cells(27, 4) Natural_gas_unit_cost = Sheets("Unit_costs").Cells(31, 4) / 1000 Metallurgical_quality_unit_penalty = Sheets("Unit_costs").Cells(21, 4) * 1000 'rate $/t