
Effects of GSH-EE Supplementation on Cardiac Function and Microvascular Density Post-TAC
This study investigates the echocardiographic outcomes and mRNA expression levels of key proteins in wild type (GCLM+/+), heterozygous knockout (GCLM+/-), and homozygous knockout (GCLM-/-) mice following transverse aortic constriction (TAC). We assess the phosphorylation of Smad3 and the expression of CTGF and procollagen in cardiac fibroblasts, along with myocardial microvessel density and hemodynamic data. Results, analyzed via statistical comparisons, aim to clarify the role of GSH-EE in mitigating cardiac complications post-surgery.

Effects of GSH-EE Supplementation on Cardiac Function and Microvascular Density Post-TAC
E N D
Presentation Transcript
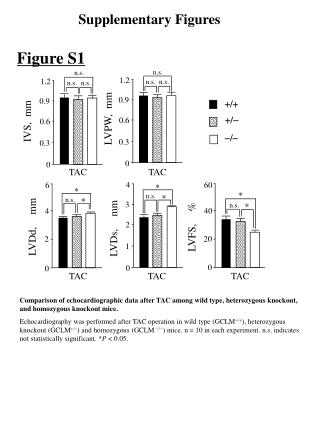
Supplementary Figures Figure S1 n.s. n.s. 1.2 n.s. n.s. 1.2 n.s. n.s. 0.9 +/+ 0.9 LVPW, mm IVS, mm +/- 0.6 0.6 -/- 0.3 0.3 0 0 TAC TAC * 4 60 6 * * n.s. * n.s. * n.s. * 3 40 4 LVDd, mm LVFS, % LVDs, mm 2 20 2 1 0 0 0 TAC TAC TAC Comparison of echocardiographic data after TAC among wild type, heterozygous knockout, and homozygous knockout mice. Echocardiography was performed after TAC operation in wild type (GCLM+/+), heterozygous knockout (GCLM+/-) and homozygous (GCLM -/-) mice. n = 10 in each experiment. n.s. indicates not statistically significant. *P < 0.05.
Figure S2 A p-Smad3 B * * t-Smad3 † † 10 * 3 † † † 7.5 † † † † † 2 5 p- / t-Smad3 mRNA expression CTGF 1 2.5 0 0 - - + + - - + + - - + + - - + + TGFb1 TGFb1 - + - + - + - + - + - + - + - + GSH-EE GSH-EE +/+ +/+ -/- -/- D C * * † † 4 2 † † † † † † 3 1.5 † † mRNA expression mRNA expression Procollagen III 2 1 Procollagen I 1 0.5 0 0 - - + + - - + + - - + + - - + + TGFb1 TGFb1 - + - + - + - + - + - + - + - + GSH-EE GSH-EE +/+ +/+ -/- -/- Smad3 phosphorylation and expression of CTGF and procollagen in cultured mouse cardiac fibroblasts The cultured cardiac fibroblasts were incubated with TGF-b1 (25 ng/mL) or vehicle in the presence or absence of GSH-EE (2 mmol/L). (A), Smad3 phosphorylation after the incubation for 24 hrs. Upper panel shows representative blotting. (B-D), mRNA expression of CTGF and procollagen I and III after the incubation for 24 hrs and 4 hrs, respectively. The mRNA levels were normalized to GAPDH mRNA expression. n = 10 in each experiment. +/+ denotes GCLM+/+ mice and -/- denotes GCLM -/- mice. *P < 0.05. †P < 0.05. The data were expressed relative to the GCLM+/+ fibroblasts treated with vehicle in the absence of GSH-EE (= 1).
2 * mRNA expression mRNA expression TGF-bR2 TIMP-2 1 0 TAC Sham +/+ +/+ -/- -/- Figure S3 x 1000 -/- +/+ 9 A B C * 2 6 Vessels / mm2 3 1 0 0 Sham TAC Sham TAC E F D x 1000 60 4 9 * * +/+ * * 45 3 -/- 6 * Vessels / mm2 F/F0 30 GSH / GSSG 2 3 15 1 0 0 0 PBS PBS GSH GSH PBS GSH 0.75 1.0 0.25 0.5 No Treat. Time (second) -/- -/- +/+ +/+ Myocardial expression of TGF-bR2 and TIMP-2 and microvessel density after TAC, transients of intracellular calcium concentration in cultured cardiomyocytes and effect of GSH-EE supplementation on myocardial microvessel density and GSH/GSSG ratio. (A, B), TGF-bR2 and TIMP-2mRNA expression. The expression levels were normalized to GAPDH mRNA expression and are shown relative to the levels in sham-operated GCLM+/+ myocardium (= 1).(C), Microvessel number per mm2 in myocardium after TAC. (D), Representative tracing of transients of intracellular calcium concentration in cultured cardiomyocytes in response to electrical stimulation. (E, F), Effects of GSH-EE supplementation during TAC on myocardial microvascular density and GSH/GSSG ratio. -/- denotes GCLM-/- mice, and +/+ denotes GCLM+/+ mice. n = 6 in each experiment. *P < 0.05.
-/- with GSH-EE -/- with PBS +/+ with no treatment * * * * Figure S4 A B C mmHg mmHg bpm 300 12 800 n.s. n.s. n.s. n.s. 9 600 200 LVEDP Systolic BP at aortic root Heart rate 6 400 100 3 200 0 0 0 TAC TAC TAC D E F mmHg/sec mmHg/sec TAC ms 0 20000 16 * * 15000 12 -5000 Maxdp/dt Tau Mindp/dt 10000 8 -10000 5000 4 * * -15000 0 0 TAC TAC Effects of GSH-EE supplementation on hemodynamic data 4 weeks after TAC operation in GCLM-/- mice. Hemodynamic study was performed in GCLM -/- mice after treatment with GSH-EE or PBS as a placebo and in GCLM+/+ mice with no treatment for 4 weeks after TAC operation. n = 6 in each experiment. n.s. indicates not statistically significant. *P < 0.05.


