Download
1 / 13
130 likes | 146 Views
Explore the latest trends and issues in corporate R&D spending based on data from over 625 companies. Gain insights into spending patterns, sector analysis, regional comparisons, and industry competitiveness.

E N D
Corporate R&D Spending:Trends and Issues Ron Freedman ron@impactg.com
Data • 625+ companies in the Research Infosource database • A reasonable sample of the 9-10,000 companies known to perform R&D (StatCan) • R&D Definitions: • Infosource: Company-defined R&D • StatCan: Frascati definition
Some Details .. • Total spending down –8.6% (with Nortel) • Total spending up 4.1% (without Nortel) • Most R&D spending (90%) concentrated in the Top 100 Spenders ($13.9 million or more) • Tier 2 companies ($2 million to $13.8 million) account for 9% • Tier 3 companies (less than $2 million) account for only 2%
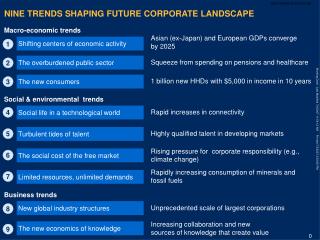
More Details … • All 3 Tiers saw a significant decline in research spending from Fiscal 2003 results • Smaller Tiers dropped most: • Tier 1 spending up 4.1% (without Nortel) • Tier 2 firms spending fell by -6.0 • Tier 3 spending fell by -16.6% • “Flywheel effect”?
The Details … • All-company R&D spending as a percent of national GDP was 1.1% for Fiscal 2002 • Ontario leads the pack with the highest rate of R&D spending as a percent of regional GDP at 1.8% (with Nortel)
Table 9. R&D Spending by Region*, 2002 and 2001 Total Companies – With and Without Nortel Networks All-Company Spending by Region *Head office location **Less than 0.5% Note: may not add due to rounding, incomplete information or bases too small to report