Download
1 / 8
80 likes | 199 Views
Student Achievement Index I. State Accountability Overview. Performance Index Framework: For 2013 and beyond, an accountability framework of four Performance Indexes includes a broad set of measures that provide a comprehensive evaluation of the campus or district.

E N D
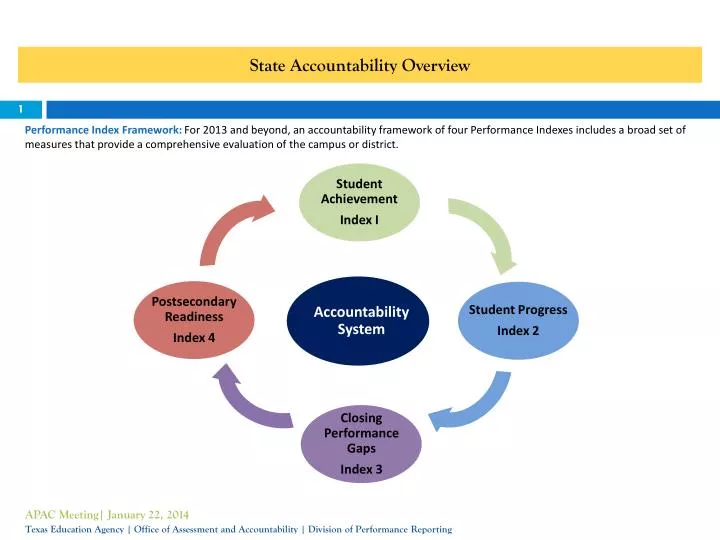
Student Achievement Index I State Accountability Overview Performance Index Framework: For 2013 and beyond, an accountability framework of four Performance Indexes includes a broad set of measures that provide a comprehensive evaluation of the campus or district. • Accountability System Student Progress Index 2 Postsecondary Readiness Index 4 Closing Performance Gaps Index 3 APAC Meeting| January 22, 2014 Texas Education Agency | Office of Assessment and Accountability | Division of Performance Reporting
Index 1: Student Achievement Index 1:Student Achievement provides an overview of student performance based on satisfactory student achievement across all subjects for all students. • 2013 • Combined over All Subjects: Reading, Mathematics, Writing, Science, and Social Studies. • Student Groups: All Students. • Performance Standards: Phase-in 1 Level II (Satisfactory). • STAAR End-of-Course (EOC) Assessments (15 total): • English l – Reading; English ll – Reading; English lll – Reading • English l – Writing; English ll – Writing; English lll – Writing • Algebra l; Geometry; Algebra ll • Biology; Chemistry; Physics • World Geography; World History; US History • English Language Learners (English and Spanish tests): • Students in US schools Year 1 - Year 3 excluded • Students in US schools Year 4 and beyond included • 2014 • Combined over All Subjects: Reading, Mathematics, Writing, Science, and Social Studies. • Student Groups: All Students. • Performance Standards: Phase-in 1 Level II (Satisfactory). • STAAR End-of-Course (EOC) Assessments (5 total): • English l (combined tests); English ll (combined tests) beginning in spring 2014 • Algebra l • Biology • US History • English Language Learners (English and Spanish tests): • Students in US schools Year 1 excluded • Students in US schools Year 2 and beyond included APAC Meeting| January 22, 2014 Texas Education Agency | Office of Assessment and Accountability | Division of Performance Reporting
Index 2: Student Progress Index 2: Student Progress focuses on actual student growth independent of overall achievement levels for each race/ethnicity student group, students with disabilities, and English language learners. • By Subject Area: Reading, Mathematics, and Writing (for available grades). • Points based on weighted performance: • One point given for each percentage of tests at the Met progress level. • Two points given for each percentage of tests at the Exceeded progresslevel. • Additional progress measures in 2014: STAAR-M, STAAR-Alt, and ELL. • Progress Measures by Subject Area and School Type: 2014 Elementary School Middle School High School READING Gr. 4 Reading Gr. 6 Reading - Gr. 5 Reading Gr. 7 Reading - - Gr. 8 Reading - --- MATHEMATICS Gr. 4 Mathematics Gr. 6 Mathematics Algebra l Gr. 5 Mathematics Gr. 7 Mathematics - - Gr. 8 Mathematics - - Algebra l - WRITING -- - 2013 Elementary SchoolMiddle SchoolHigh School READING Gr. 4 Reading Gr. 6 Reading English l Reading Gr. 5 Reading Gr. 7 Reading English ll Reading - Gr. 8 Reading - - English l Reading - MATHEMATICS Gr. 4 Mathematics Gr. 6 Mathematics Algebra l Gr. 5 Mathematics Gr. 7 Mathematics - - Gr. 8 Mathematics - - Algebra l - WRITING - - English ll Writing APAC Meeting| January 22, 2014 Texas Education Agency | Office of Assessment and Accountability | Division of Performance Reporting
Index 3: Closing Performance Gaps Index 3:Closing Performance Gaps emphasizes advanced academic achievement of economically disadvantaged students and the two lowest performing race/ethnicity student groups. • 2014 • Pointsbased on STAAR performance: • Phase-in 1 Level II satisfactory performance: One point for each percent of tests at the Phase-in 1 Level II satisfactory performance standard. • Level III advanced performance:Two points for each percent of tests at the Level III advanced performance standard. • By Subject Area: Reading, Mathematics, Writing, Science, and Social Studies. • Student Groups: • Economically Disadvantaged • Lowest Performing Race/Ethnicity: The two lowest performing race/ethnicity student groups on the campus or within the district, based on 2013 assessment results. • 2013 • Pointsbased on STAAR performance: • Phase-in 1 Level II satisfactory performance: One point for each percent of tests at the Phase-in 1 Level II satisfactory performance standard. • By Subject Area: Reading, Mathematics, Writing, Science, and Social Studies. • Student Groups: • Economically Disadvantaged • Lowest Performing Race/Ethnicity: The two lowest performing race/ethnicity student groups on the campus or within the district, based on 2012 assessment results. APAC Meeting| January 22, 2014 Texas Education Agency | Office of Assessment and Accountability | Division of Performance Reporting
Index 4: Postsecondary Readiness Index 4:Postsecondary Readiness emphasizes the importance of earning a high school diploma that provides students with the foundation necessary for success in college, the workforce, job training programs, or the military; and the role of elementary and middle schools in preparing students for high school. 2013 • Graduation Score: Combined performance across the graduation and dropout rates for: • Grade 9-12 Four-Year Graduation Rate for All Students and all student groups; or • Grade 9-12 Five-Year Graduation Rate for All Students and all student groups, whichever contributes the higher number of points to the index. • RHSP/DAP Graduates: All Students and race/ethnicity student groups. 2014 • Graduation Score: Combined performance across the graduation and dropout rates for: • Grade 9-12 Four-Year Graduation Rate for All Students and all student groups; or • Grade 9-12 Five-Year Graduation Rate for All Students and all student groups, whichever contributes the higher number of points to the index. • RHSP/DAP Graduates: All Students and race/ethnicity student groups. • STAAR Score: STAAR Percent Met Final Level ll on one or more tests for All Students and race/ethnicity student groups. Additional Indicators Required by House Bill 5 (83rd Texas Legislature, 2013) • Texas Success Initiative college readiness benchmarks. • Number of students who earn postsecondary credit required for a foundation high school program, an associate’s degree, or an industry certification. APAC Meeting| January 22, 2014 Texas Education Agency | Office of Assessment and Accountability | Division of Performance Reporting
Distinction Designations • 2013 Distinction Designation • Campus Top Twenty-Five Percent: • Campuses in the top quartile of their campus comparison • group earn a distinction designation. • Student Progress (based on Index 2) • Academic Achievement in: • Reading/English Language Arts • Mathematics • 2014 Distinction Designation • Campus Top Twenty-Five Percent: • Campuses in the top quartile of their campus comparison • group earn a distinction designation. • Student Progress (based on Index 2) • Closing Performance Gaps (based on Index 3) • Academic Achievement in: • Reading/English Language Arts • Mathematics • Science • Social Studies • Districts and Campuses Postsecondary Readiness: • House Bill 5 (83rd Texas Legislature, 2013) expanded distinction • designations to both districts and campuses for outstanding performance in attainment of postsecondary readiness. • Criteria must include indicators based on percentages of students who: • Achieve college-readiness standards on STAAR; • Earn nationally or internationally recognized business/industry certification; • Complete a coherent sequence of CTE courses; • Complete dual credit courses or a postsecondary course for local credit; • Achieve college readiness standards on SAT, ACT, PSAT, or ACT-PLAN examinations; and • Earn college credit based on AP/IB performance. APAC Meeting| January 22, 2014 Texas Education Agency | Office of Assessment and Accountability | Division of Performance Reporting
Accountability Ratings and Designations APAC Meeting| January 22, 2014 Texas Education Agency | Office of Assessment and Accountability | Division of Performance Reporting
Legislative Changes - 83rd Texas Legislature, 2013 • Dropout Recovery • Beginning with the 2013-14 school year, school districts will be required to evaluate dropout recovery schools, which are defined as: • serves students in grades 9-12; • has enrollment of which at least 50 percent of the students are 17 years of age or older as of September 1 of the school year; and • meets the eligibility requirements for and is registered under alternative education accountability procedures adopted by the commissioner. • Accountability Ratings • Beginning with the 2016-17 school year, TEA is required to assign ratings of A, B, C, D, or F to districts, and ratings of exemplary, recognized, acceptable, or unacceptable to campuses. • Community and Student Engagement • Beginning with the 2013-14 school year, districts will be required to evaluate community and student engagement for the district and each of their campuses and assign a rating. The ratings are required to be reported to TEA by August 8, 2014. • Districts will be required to assign a performance rating of exemplary, recognized, acceptable, or unacceptable based on locally determined criteria. These performance ratings must be based on criteria developed by a local committee. The agency is not permitted to determine the criteria that can be used for these evaluations. • For the 2013-14 school year, TEA will collect the locally-determined ratings in the summer 2014 PEIMS Submission 3 for the district and each campus in the district. TEA will report these ratings publicly by October 1, 2014. APAC Meeting| January 22, 2014 Texas Education Agency | Office of Assessment and Accountability | Division of Performance Reporting