Download
1 / 1
10 likes | 105 Views
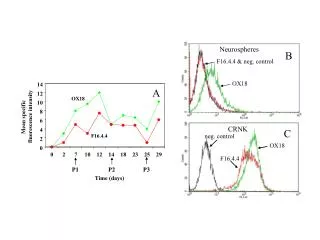
Study of specific fluorescence intensity in neurospheres over days. Analysis of control and experimental groups to assess changes in F16.4.4.2.0.0.2.7.10.12.14.18.23.25.29.P1.P2.P3 markers.

E N D
F16.4.4 & neg. control OX18 OX18 14 A 12 OX18 10 Mean specific fluorescence intensity 8 6 4 F16.4.4 2 0 0 2 7 10 12 14 18 23 25 29 P1 P2 P3 Time (days) Neurospheres B CRNK C neg. control F16.4.4