Download
1 / 16
160 likes | 289 Views
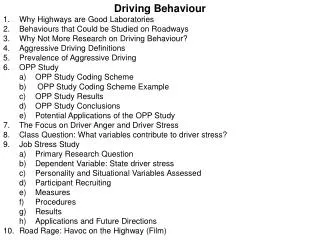
Why Highways are Good Laboratories. High traffic volumes facilitate the study of infrequently displayed behaviour Drivers may feel deindividuated Low probability of future encounters with same drivers Multiple stressors present in highway driving

E N D
Why Highways are Good Laboratories • High traffic volumes facilitate the study of infrequently displayed behaviour • Drivers may feel deindividuated • Low probability of future encounters with same drivers • Multiple stressors present in highway driving • Automobile is a weapon as well as a means of escape • Certain behaviours (e.g., vengeance) may not be seen off the road • Highways are ubiquitous
Behaviours that could be studied on roadways: • Prosocial behaviours (helping, courtesy, cooperation, etc. • Anti-social behaviours (aggression, violence,vengeance) • Social influence processes (conformity, modelling, norm formation, etc.) • Deindividuation • Cognitive processes • Wayfinding and route learning • Stress and coping
Why not more research on driving behaviour? • Funding difficulties: too applied for psychological funding agencies and too academic for road safety professionals • Road safety professionals are mostly engineers and tend to view problems as attributable to technical reasons and see engineering solutions to problems • The problem driver has traditionally been viewed as the alcohol consuming driver, so attempts to control this problem has dominated the international agenda • Difficulties in securing cooperation to study behaviour on roadways • Laboratory research is easier and more convenient to perform
Aggressive Driving and Public Concern • Traffic Injury Research Foundation Survey (Ottawa): 1200 telephone interviews across Canada • 65% indicated aggressive driving constituted a serious problem and felt it was a greater danger than sleepy drivers, road conditions, or vehicle defects • 74% viewed red light running a serious problem • 2/3 considered speeding a serious risk • Women felt more threatened than men • Ontario drivers reported more encounters with aggressive drivers than those in other provinces
Aggressive Driving and Public Concern • Toljagic (2000) indicated that 38% of Ontario drivers reported some abusive behaviour over the past year • Goehring (2000) reported 90% of AAA members witnessed an aggressive driving incident over a year • Wald (1997) estimated 28,000 highway fatalities in the USA were attributable to aggressive driving • Rasmussen, Knapp & Garner (2000): 22% of drivers in Las Vegas reported other drivers to the police. Major sources of annoyance: slow drivers, children not in child seats, tailgating, tourists uncertain of route, cars weaving in and out of lanes. They perceived an increase (76%) in aggressive driving over a 5 year period and felt Las Vegas drivers were worse than elsewhere (58%).
Opinion Search conducted a 75 item telephone survey in September 2006 6,075 household contacted, but 73% refused to participate 7.5% were not eligible for the survey (the respondent had to have driven in the past 30 days 1,201drivers completed the survey Sample accuracy = 2.9% 19 times out of 20 Aggressive Driving: TIRF 2006 Road Safety Monitor Survey
Aggressive Driving: TIRF 2006 Road Safety Monitor Survey • 88% of Canadians believe aggressive driving has increased over the last 5 years • 2.7 million admit to exceeding the speed limit • 2 million admit to speeding to get through a traffic light • 670,000 admit they take driving risks for “fun”
Aggressive Driving: TIRF 2006 Road Safety Monitor Survey Characteristics of Aggressive Drivers: • Twice as many male aggressive drivers than females • Drivers 16-24 are more likely to use their horn • Drivers 16-44 were more likely to behave aggressively in traffic • Aggressive drivers reported at least one traffic ticket
Aggressive Driving: TIRF 2006 Road Safety Monitor Survey Support for Measures to Control Aggressive Drivers: • 63% agree that aggressive driving should receive greater attention from police • 51% believe penalties for aggressive driving should equal those for intoxicated driving • 43% agree that vehicles should have speed limiting devices
Suggestions for Reducing Highway Aggression • Tension reduction strategies: • Use cell phones to inform others of delays • Listen to traffic reports and use alternative routes where possible • Listen to music, books-on-tape in cars while driving • Anger management • Screen all drivers • When a given demerit point level is reached, provide anger management workshops • Enforcement of highway traffic act • Tailgating • Signalling of lane changes • Use of left lane as passing lane
Suggestions for Reducing Highway Aggression • Promotion of mass transportation • Deindividuation reduction: • Paint driver’s names/towns on doors and backs of vehicles • Ban deep tints • Promote vanity licence plates
Main Findings • Trait X State stress interaction: congestion does not affect everyone the same since high trait stress drivers reacted more strongly to high congestion situations • No gender differences • No difference in coping responses across congestion conditions • Drivers prefered direct coping responses, but used both direct and indirect behaviours equally • Compared to other responses, aggressive behaviours dramatically increased as traffic congestion increased
Frequency of Individual Violent Driving Behaviours(Hennessy, Ph. D dissertation) BehaviourFrequency Chasing another driver/vehicle 40% (58) Verbal roadside confrontation 23% (33) Vandalizing another vehicle 14% (20) Throwing objects at another vehicle 11% (16) Physical roadside confrontation 7% (10) Purposeful contact with another vehicle 4% (6) Drive-by shootings 1% (2)