GIS and evaluating ecosystem services
230 likes | 386 Views
GIS and evaluating ecosystem services. Jim Quinn Information Center for the Environment UCDavis jfquinn@ucdavis.edu. Economic Outputs of Sustainably Managed Ecosystems. Marketed goods Food and fiber Recreational opportunities Water Coming – Carbon Sequestration.

GIS and evaluating ecosystem services
E N D
Presentation Transcript
GIS and evaluating ecosystem services Jim Quinn Information Center for the Environment UCDavis jfquinn@ucdavis.edu
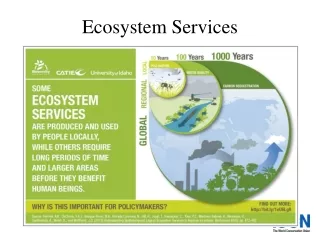
Economic Outputs of Sustainably Managed Ecosystems • Marketed goods • Food and fiber • Recreational opportunities • Water • Coming – Carbon Sequestration
Economic Outputs of Sustainably Managed Ecosystems • Costs avoided • Health impacts of air and water pollution • Fire • Flooding • Non-market values • Wildlife • Stewardship values, etc.
Big money • New York City • $4.5 billion in water treatment avoided • Millennium Assessment • Hundreds of billions of savings to cities in water supply and water quality alone • Just because large amounts of money are hard to measure doesn’t mean they should be ignored
Charge to land use agencies, planners, and NGOs • A land use plan that provides an effective portfolio of production and ecosystem values • Institutional framework so beneficiaries reimburse providers
What do we know pretty well? • Land use and land cover • Drinking water quality • Watershed management projects
Drinking Water Sources for Public Water Systems* in California
Where do we need better information? • Non-point-source threats • (e.g. nutrients and pathogens from septic systems) • Groundwater recharge zones • Water delivery and pricing
What can we model? • Future land use • Watershed exports • Economic performance of competing land use scenarios (as in the Blueprint process)?
Future Land UseSJ Valley Growth Scenarios (UPlan) • Many Different types: • Compact • Species Protection • Ag. Protection • Urban Cores • Economic Development
Restoring Impaired WaterwaysRiparian-Topographic Shading Model Vegetation Distribution Converted to Height by DBH Class & Percent Hardwood / Conifer Hourly Solar Incidence for Critical Date: July 22 Riparian Corridor Delineation 200 meter radius from streams 1996 Aerial Photographs Reach Averaged Values attributed to linear hydrographic network for Current Conditions & Potential Conditions Digital Elevation Model 10 meter resolution
RipTopo Model Results Current Shading Conditions Potential Shading Conditions