Download
1 / 11
110 likes | 125 Views
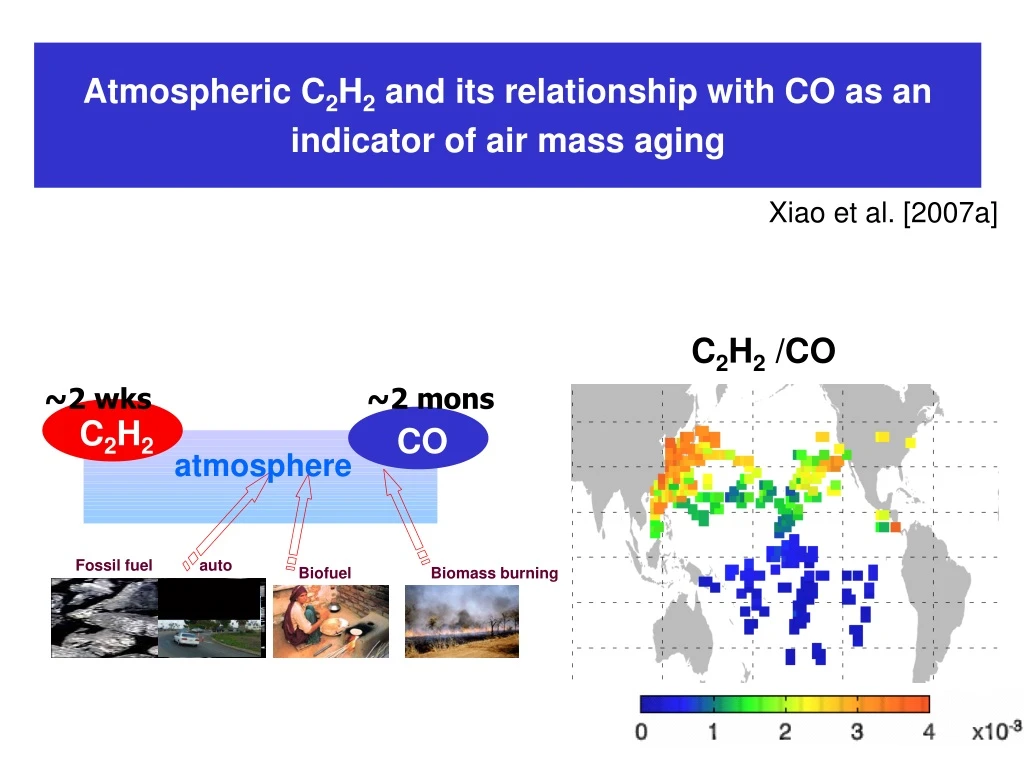
This study investigates the correlation between C2H2 and CO in the atmosphere to test model emissions, transport, and OH levels. The study concludes that the C2H2/CO ratio is a reliable tracer of air mass aging, reflecting a combined influence of emission, transport, chemistry, and background.

E N D
~2 wks CO C2H2 ~2 mons atmosphere Fossil fuel auto Biofuel Biomass burning Atmospheric C2H2 and its relationship with CO as an indicator of air mass aging C2H2 /CO Xiao et al. [2007a]
C2H2-CO correlation: a test of model transport and chemical processes Objective: to determine the information contained in C2H2-CO relationship for testing model emissions, transport, and OH levels
Atmospheric C2H2 sources Tg/year The model shows no significant bias in reproducing the major features of C2H2 observed in atmosphere
C2H2/CO ratio: a tracer of air mass aging Observation (0-2 km): TRACE-P, PEM-Tropics B Model: averaged 0-2 km
C2H2/CO slope: not a robust tracer of air mass aging observations model The variation of C2H2/CO slope reflects a combined influence of emission, transport, chemistry, and background. (1)(2)(3): TRACE-P, March (BL) (4)PEM-West A, September (UT) (5) PEM-Tropics B, March (BL) (6) PEM-Tropics A, September (FT) (7) TRACE-A, September (FT) (8) INTEX-A, Jul-Aug (BL) (8) (4) (8) (1) (3) (4) (3) (1) (2) (2) (7) (5) (6) (7) C2H2 CO
Interpretation of log[C2H2]-log[CO] slope by Ehhalt et al. [1998] β=1 dilution dominates β= dilution ~ chemistry β> chemistry dominates chemistry dominates ~ 1.7-1.9 dilution dominates Narrow range!
Interpretation of log[C2H2]-log[CO] slope by GEOS-Chem chemistry dominates ~ 1.7-1.9 dilution dominates Our model results are generally consistent with Ehhalt et al. [1998]
Regional constraints on U.S. sources of ethane Xiao et al. [2007b] Persistent underestimate of C2H6 emissions in the U.S. EPA National Emissions Inventories, including the latest NEI-99. INTEX-A (July-August, 2004)
Simulation of C2H6 observations in INTEX-A (Jul-Aug,2004) 47% 28% Note different color scales! EPA NEI-99 * 3.5 Industrial solvent Other Industrial (ngas/oil) Biomass burning source of C2H6 is minor compared to fossil fuel source
Optimized C2H6 emissions in the United States x7 in NEI-99 for the southern United States x1.8 in NEI-99 for the northern United States Model [NEI-99 * 3.5] / obs (< 2km) 1.3 1.6 0.7
Estimated CH4 emission from natural gas/oil source in U.S. a major U.S. contribution to greenhouse warming is underestimated! C2H6 emission in U.S CH4/C2H6 ER from fossil fuel 2.4 Tg yr-1 19 mol mol-1 ground samples near natural gas/oil source region in south-central US [Katzenstein et al., 2003] CH4 fossil fuel emission in U.S. 24 Tg yr-1 as compared to: 10.5 Tg estimated by EIA (2005) 20 Tg by Wang et al. [2004]