Download
1 / 65
650 likes | 667 Views
Join WSDOT Active Transportation experts to discuss improving safety, mobility, and access through sustainable transportation options. Share challenges, ideas, and priorities to shape the State Active Transportation Plan.

E N D
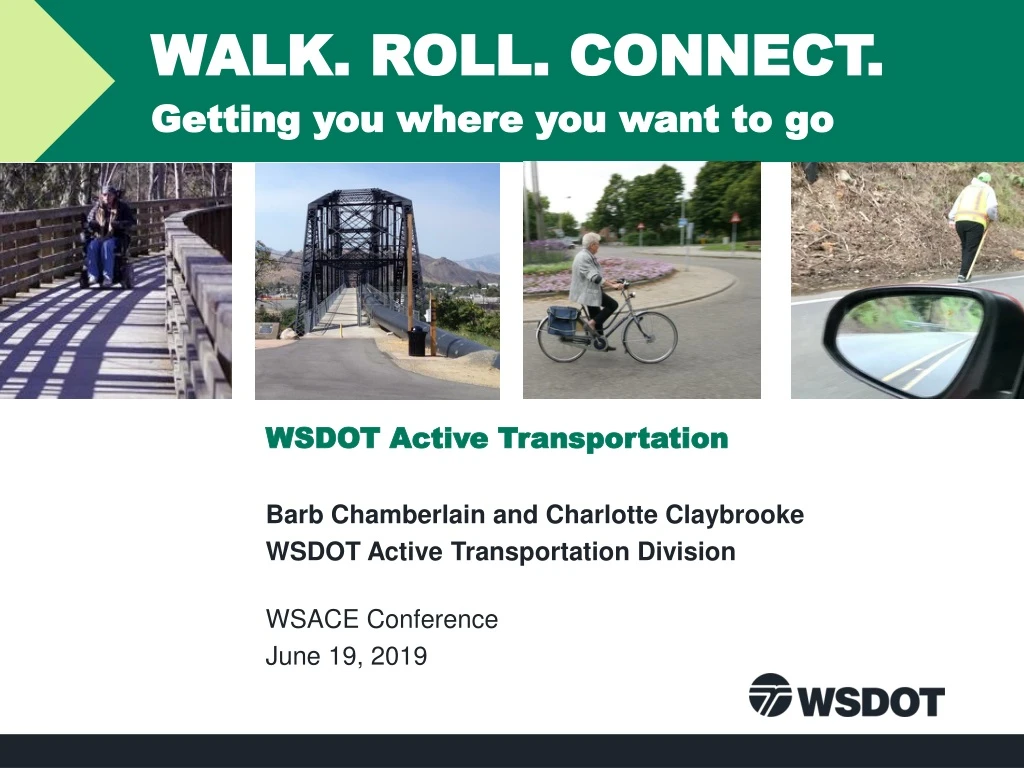
WALK. ROLL. CONNECT. Getting you where you want to go WSDOT Active Transportation Barb Chamberlain and Charlotte Claybrooke WSDOT Active Transportation Division WSACE Conference June 19, 2019
Today’s session • Warm-up:Talking with each other about active transportation • Welcome and overview: WSDOT Active Transportation Division • State Active Transportation Plan Update: What and why + your feedback • Systematic safety: Principles and tools to improve safety for all + your challenges and opportunities • Wrap-up 2
Warm-up: Active Transportation in Your County • The questions: • What big challenges do you face in active transportation? • What’s one thing you’ve done around active transportation, and one thing you hope to getfrom this session? • The instructions: Pair up with someone you don’t know well. • Each of you gets 1-1/2 minutes to talk uninterrupted about these questions. The other person’s job is to listen to you. When bill rings, it’s the other person’s turn to talk, you listen. • Rotate to have 2 more of these conversations. • A little sharing of observations. 3
How to use the forms • Active Transportation in Your County: Front side: Thoughts from the conversations you just had and what you shared. Back side: Other ideas that come up during the session. • Network Analysis: Front side: Specific questions to address. Back side: General thoughts and questions about the approach. • Prioritization Framework: Front side: Thoughts about the factors on the list, others you would add. Back side: How you would assign a weight or point value to each factor you would include. • Systematic Safety: What questions do you have about the principles, plans and guidelines being developed? What data, analysis or training do you need? What are the most important takeaways? • Putting It All Together: What big question, challenge or opportunity around active transportation do you think is most important to address? 4
Form: Active Transportation in Your County • Make notes on form labeled Active Transportation in Your County • Front side: Capture thoughts from the conversations you just had and what you shared. • Back side: Keep making notes as other thoughts come up during the session. • We’ll collect these and use them as input on the Active Transportation Plan and for development of trainings and materials 5
WSDOT's multimodal commitment: Options for all • WSDOT Vision: Washington travelers have a safe, sustainable and integrated multimodal transportation system. • WSDOT Mission: We provide safe, reliable and cost-effective transportation options to improve communities and economic vitality for people and businesses 6
Active Transportation Division • Policy Development, Review, Support • Capacity Building and Training: Manuals, guidelines, technical assistance, workshops • Planning and Projects: Active Transportation Plan, other modal/system plans, planning studies, project design review/input • Research and Analysis: Counter program, crash data, safety, mobility, accessibility • Grant Programs: Safe Routes to School, Pedestrian/Bicyclist Program (2019 session ~$41M funding, $187.4M in requests) • Communications, Engagement, Partnerships 7
Complete, comfortable active transportation connections have benefits for all road users • Mobility for all and access to opportunity • Especially for people who don’t drive or can’t afford a reliable vehicle • Economic value • Increased business on Main Streets • Bike tourism spending (more $ per traveler than driving visitors) • Cleaner air and waterSafety for everyone on well-designed streets, roads and highways • 36-44% reduction in pedestrian/bicyclist crashes at SRTS/PBP grant project sites • Healthy people and communities • Demographic reality: People have to stop driving at some point. Then what?? 8
Safety improves for every road user • Infrastructure guides behaviors and decisions • Clear pathways provide more predictability • More separation between modes reduces number and severity of crashes for all • And everyone is a pedestrian at some point in their journey • (More on this in the Systematic Safety section) 10
Active transportation in the future Vision Walking and bicycling transportation connections are complete and comfortable. As a result, Washingtonians of all ages and abilities can walk or roll to get where they need to go, with safety and mobility improvements for everyone. 3
What is the Active Transportation Plan? It’s one set of tools in a growing list of activities across WSDOT to embed multimodal policy, practice, and problem-solving. • Multimodal updates to manuals • STEP Pedestrian Crossing Action Plan • Highway Crossing Study • Speed Management Policy Work Group 12
What is the Active Transportation Plan? The 2019 ATP Update will help guide and implement investments and policies for increased access, safety and mobility to enable Washingtonians of all ages and abilities to walk, bike and roll. The ATP serves as the statewide needs assessment required under RCW 47.06.100 and fulfills the federal requirement for a transportation system plan that integrates accessible pedestrian walkways and bicycle transportation facilities under 23 USC §135. 13
Context for the state AT plan Transportation decisions start at the front door. All of these plans affect which options you have available when and where you need them. 14
Ongoing planning improves our statewidetransportation system 15
Active Transportation Plan Ingredients Improving mobility, accessibility, safety • Analyzing connections, gaps and barriersWhat enables people of all ages and abilities to get from here to there safely? • Connecting active transportation to other modes Where do people connect to transit, ferries, rail, and air? • Prioritizing projects and programsWhich comes first and why? • Managing assetsWhat do we own, how well does it serve a safe, accessible, connected network? • Understanding fundingand policyWhat do we need to do to make progress? • Measuring performance How do we track and report meaningful progress? 16
Active Transportation Plan Ingredients What’s in the toolkit Asset managementWhat do we own, how well does it serve a safe, accessible, connected network? Funding and policyWhat do we need to make progress? Performance measuresHow do we track and report meaningful progress? 17
Active Transportation Plan Ingredients Questions we seek to answer • What enables people of all ages and abilities to get from here to there safely? • Where do people need walk/roll connections to transit, ferries, rail, and air? • Projects and programs: Which changes do we work on first and why? • What do we own as transportation assets and how well do they serve a safe, accessible, connected network? • What do we need to do to make progress? • How do we track and report meaningful inputs, outputs and outcomes? 18
Form: Network Analysis • Make notes on form labeled Network Analysis • Front side: Specific questions for you to address. • Back side: General thoughts and questions about network analysis, US Bicycle Route System, local and regional connections. • We’ll collect these and use them as input on the Active Transportation Plan and for development of trainings and materials 19
Active Transportation Plan Ingredients Improving mobility, accessibility, safety • What enables people of all ages and abilities to get from here to there safely? • Focus on state right-of-way to begin with, add partner data over time • Identify where we need crossings, improvements, signage and connections to complete the local/regional networks, link them for a statewide network 20
Every jurisdiction owns a piece of the statewide network • US Bicycle Route System • Local jurisdictions sign off on support for designation • Regional trail systems • Local infrastructure, routes • Multimodal connections: Rail, ferries, transit, air • Signage + wayfinding • Someday: State Scenic Bikeways? • “Wallets on Wheels”: >$3.1 billion annual spending on bicycle travel/tourism 21
US Bicycle Route System US Bicycle Routes State of Washington 22
Active Transportation Plan Ingredients Bicyclist Level of Traffic Stress LTS 3 LTS 4
Form: Network Analysis • Make notes on form labeled Network Analysis • Front side: Specific questions for you to address. • Back side: General thoughts and questions about network analysis, US Bicycle Route System, local and regional connections. • We’ll collect these and use them as input on the Active Transportation Plan and for development of trainings and materials 28
Form: Prioritization Framework • Make notes on form labeled Prioritization Framework • Front side: Thoughts about the factors on the list, others you would add (not cost—this is the BENEFITS side of the equation). • Back side: How you would assign a weight or point value to each factor you would include. • We’ll collect these and use them as input on the Active Transportation Plan and for development of trainings and materials 29
Active Transportation Plan Ingredients Prioritization Framework—DRAFT • Which things first and why? • Safety: Crash history, systematic safety approach • Connectivity/ Completeness: Completes a network connection to existing or planned facilities or to another mode • Need: Provides access to high-need populations • Existing Quality: Based on Network Analysis • Project Quality: Facility quality if project is implemented • Demand: Analysis performed as another element in the plan • WHAT ELSE? Asset managementWhat do we own, how well does it serve a safe, accessible, connected network? Funding and policyWhat do we need to make progress? Performance measuresHow do we track and report meaningful progress? 30
Active Transportation Plan Ingredients Prioritization Framework—Your Thoughts • What’s missing as a primary factor that would be important and useful to consider? • What value or weight would you assign to each factor? • What if this is how we prioritize grant awards? Asset managementWhat do we own, how well does it serve a safe, accessible, connected network? Funding and policyWhat do we need to make progress? Performance measuresHow do we track and report meaningful progress? 31
Pedestrian and Bicycle Program and Safe Routes to School Program Active Transportation Division Washington State Department of Transportation
Form: Prioritization Framework • Make notes on form labeled Prioritization Framework • Front side: Thoughts about the factors on the list, others you would add (not cost—this is the BENEFITS side of the equation). • Back side: How you would assign a weight or point value to each factor you would include. • We’ll collect these and use them as input on the Active Transportation Plan and for development of trainings and materials 33
Active Transportation Plan timeline • Mar – Apr 2019DIY Outreach Toolkit launchNetwork analysisPrioritization framework • Apr – Jun 2019Round 1 outreachPerformance metricsFunding assessment • Jul – Aug 2019Round 2 outreachAsset managementPolicy review • Sep – Oct 2019Outreach continuesDraft plan developed • Oct – Nov 2019Review + refine draft ATPPublic comment on draft ATP • Dec 2019Distribute final ATP 34
Systematic Safety • Fatal and Serious Injury Crashes • Principles of Systematic Safety • Speed Management for Injury Minimization • Safe Transportation for Every Pedestrian (STEP) Action Plan 35
We must address unacceptable rise in crashes, serious injuries, and fatalities 36
Putting safety in contextWashington State 2018 The loss of a human life isincalculableto those who knew and loved the person. This loss also affects society; that person’s contributions to family, community and work are gone forever. This is why USDOT gives us a way to calculate the statistical value of a life. $1.2 billion (123 fatalities) + $524 million (519 serious injuries) = $1.724 billion 37
Safe Systems – Injury Minimization Approach • Humans will make mistakes. Need to create a system that works by design to make road user deaths and serious injuries nearly impossible. • Re-engineer the transportation system to give more forgiveness, both limiting speed naturally and changing the way that collisions occur to reduce kinetic energy exchange. 38
Systematic Safety Principles • Speed control and separation – Low speeds are used when there is a mix of users and separation is used where higher speeds are necessary • Functional harmony – Road characteristics match the type of trip (local vs passing through) and the land use context. • Predictability and simplicity – Road design and traffic control make it obvious what to do and what to expect from each others using the road. • Forgiveness and restrictiveness – Road design that prevents mistakes and makes them less likely to result in serious or fatal injury if they do occur. • State awareness – Change or control of road user behaviors using enforcement and education. 39
The central tenet of the safe system approach is safe speeds. 40
Putting safety in contextWashington State 2018 10 times a day 10 times a daya motorist collision involved someone walking or rolling. Every14 Hours Every 13.65 hours a motorist struck and seriously injured or killed someone walking or rolling. Every3 Days On average, a driver killed someone walking or bicycling every 2.96 days 41
Injury Minimization and Speed Management Work Group Develop policies and guidelines that emphasize lower speeds where appropriate compatible with the needs of all users. Consider: • Traveler expectations; • Traffic control measures; • Design controls; • Impacts to vehicle through-put; • Different approaches for different roads and context; • Resource availability/limitations; • Current practices; Speed Limit and Speed Management Practices in Washington Survey 42
What factors do you consider when evaluating or changing a speed limit? 85th Percentile Speed Road characteristics Pace speed Development Parking practices Population types Crash history Walk/Bike activity Comprehensive plans An expert system Multimodal level of service Travel times effects Standard Operating Procedures Other 43
How confident are you that speed management measures will result in a desired operational speed? 44
Does your agency have a funding mechanism to implement speed management strategies, when a speed limit should be lowered but operating speeds are high? 45
If minimizing injury severity were the only thing you had to consider, what target speed would you establish? 46
Safe Systems – Manage the kinetic energy transferred among road users Where traffic modes mix the safest speed is 20mph. When crash impact speed rises from 20mph to 30mph the fatality risk to pedestrians increases five to eight times. Where there is potential for vehicle to vehicle side-impact crash (T-bone), the safe speed is 30mph The speed that serious injury is less likely to result. Where there is a possibility of head-on crash risk a safe speed is 45mph. To accommodate higher speeds, opposite-flow traffic must be separated. 47
Predictability and Simplicity – Pedestrian Crossing Action Plan STEP Purpose - provide a plan to improve crossing conditions as needed where the pedestrian network is interrupted by roads. 48
Predictability and Simplicity – Pedestrian Crossing Action Plan STEP Recommendations provide process/guidance to identify: • Where pedestrian crossing need exists; • How to prioritize unmet need; • How to make best use of existing and future funding; • How to obtain the right mix of effective treatments. 49
Pedestrian Crossing Action Plan Recommendation Continue to collect and map pedestrian-involved crashes, on a yearly basis, to identify high crash locations and corridor segments to help identify and prioritize locations to apply proven pedestrian safety countermeasures. 50