Download
1 / 17
170 likes | 313 Views
Do Now : 1. Don’t loose your identification card. 2. In your notebook, define “acid”, “base”, and “buffer” Agenda : Return- Microscope Quiz Return- Microscope Lab Demo- Buffer Lab- Effectiveness of Antacids Homework: Enjoy your afternoon!. Return Microscope Quiz

E N D
Do Now: 1. Don’t loose your identification card. 2. In your notebook, define “acid”, “base”, and “buffer” Agenda: Return- Microscope Quiz Return- Microscope Lab Demo- Buffer Lab- Effectiveness of Antacids Homework: Enjoy your afternoon!
Return Microscope Quiz Return Microscope Lab
Marshmallow ACID- Any substance which releases H+ (hydrogen) ions in water. pH range- below 7
BASE: Any substance which releases OH- (hydroxide) ions in water. pH range- above 7 Paperclip, Marshmallow, Lifesaver
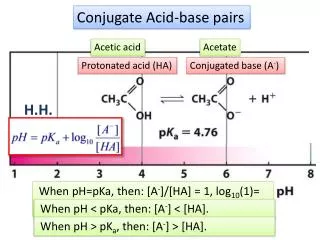
BUFFER: a strong acid/base that reacts with a weak acid/base to neutralize the pH of a solution. 2 Paperclips twisted (taped) together
Construct your molecule Marshmallow ACID- BASE- BUFFER- Paperclip, Marshmallow, Lifesaver 2 Paperclips twisted (taped) together If you hope to enjoy the food AFTER the demo, please do NOT place your materials on a table/drop them or they may not be consumed.
DEMO: Room= Beaker of water Bases enter the beaker. What happens to the pH? Acids enter the beaker. What happens to the pH? What did the bases turn into? Buffers enter the beaker. What happens to the pH? Add a few acids. What happens to the pH? Eventually what happens to the pH? Why?
With your partner, complete the Prelab Questions
Preparing Antacid Solution • Clean your cup with soap and water. • Crush antacid tablet using mortar and pestle. • Measure 1g of antacid using the scale. • Place the 1g of antacid into your cup. • Add 100mL of water to cup • Mix using the glass stirring rod, until antacid is completely dissolved. • Using the pH strips, determine the initial pH • Record the Initial PH for antacid 1 in Table 1.
Adding Acid to Antacid • Add 10 drops (0.5mL) of vinegar (acid) to your cup & stir using the stirring rod. • Observe and determine pH. Record the pH in Table #1 for Antacid 1 under “0.5mL” • Continue adding 10 drops to your solution, stirring each time. Measure the pH after each set of drops and record in Table 1 until the solution reaches a pH of 4. • When/if you reach 5mL of acid and the pH hasn’t dropped to 4 yet, increases doses to 20 drops each trial.
Adding Acid to Antacid Write in the name of antacids
Clean Up Dump liquid down sink. Wash with soap and dry the plastic cup. Wash with soap and dry mortar & pestle. Wash with soap and dry glass stirring rod. Put the lid back on the jar of vinegar. Throw out used pH strips & weighing paper. Your table should be as neat as you found it.
Sharing Data • Share your data with another team and copy their data onto your Table #1. Table #1 should now have two teams work. Your team’s data Another team’s data Your team’s data cont’d Another team’s data cont’d
Sharing Data • Using Table #1 graph both teams data to have a comparison of antacid effectiveness. X axis- independent variable (scientists change) Y axis- dependent variable (scientists measure) Don’t forget title, labels w/ units, and a key! Use your graph to answer conclusion question 1. • Inform the teacher how many mL of acid was added to reach the pH of 4. This will be used for the class data. • Copy class’ data into Table #2 in order to answer conclusion question 2.
Reminders No sitting during lab. No beverages/food in lab.