Download

1 / 30
310 likes | 569 Views
CHAPTER 3 DEVELOPING A BUSINESS PLAN: COST-VOLUME-PROFIT ANALYSIS. Chapter Overview. Since the future is uncertain and circumstances are likely to change, why should a company bother to plan? What should a company include in its business plan?

E N D
CHAPTER 3 DEVELOPING A BUSINESS PLAN: COST-VOLUME-PROFIT ANALYSIS
Chapter Overview • Since the future is uncertain and circumstances are likely to change, why should a company bother to plan? • What should a company include in its business plan? • How does accounting information contribute to the planning process? • What must decision makers be able to predict in order to estimate profit at a given sales volume?
Chapter Overview • How can decision makers predict the sales volume necessary for estimated revenues to cover estimated costs? • How can decision makers predict the sales volume necessary to achieve a target profit? • How can decision makers use accounting information to evaluate alternative plans?
Planning in a New Company • Planning is an ongoing process for successful companies. • A business plan is an evolving report that describes a company’s goals and its current plans for achieving these goals. • A business plan is used by both internal and external users.
A description of the company, • A marketing plan, • A description of the operations of the company, and, • A financial plan. The Business Plan • A business plan typically includes:
The Financial Plan • A major component of a company’s business plan is the financial plan. • The purpose of this plan is to identify the company’s capital requirements, sources of capital, as well as to describe the company’s projected financial performance.
Sources of Capital • Short-term capital represents those resources raised by the business that will be repaid within a year or less. • Examples include buying inventory on credit from a supplier or acquiring a line of credit from the bank that allows a company to borrow money “as needed.”
Sources of Capital • Long-term capital represents resources raised by the business from investors or creditors which will be repaid or returned in more than a year. • Examples include cash investments by owners, selling stock to investors, or arranging long-term financing with a bank.
Projected Financial Performance • This section of the financial plan projects how the company will perform under various scenarios. • For example, Sweet Temptations might ask “What will our profit be if we sell only 800 boxes of chocolate? How will it change if we sell 1,300 boxes of chocolate?” • The financial performance section is supported by cost-volume-profit analysis and budgets.
Cost-Profit-Volume (CVP) Analysis • CVP analysis shows how profit will be affected by alternative sales volumes, selling prices, and costs. • CVP analysis is based on a simple profit computation that establishes a relationship between revenues and costs. • In order to use CVP analysis effectively, decision makers must understand how costs behave at different volume or activity levels.
Fixed Cost Behavior • Fixed costs are constant in total for a specific time period; they are not affected by differences in volume during that same period. • Fixed costs are depicted by the horizontal straight-line on a graph, indicating that the cost will be the same (fixed) over different volumes levels.
Fixed Cost BehaviorExhibit 3-3 • As Sweet Temptation’s sales volume increases, monthly rent remains constant at $1,000 per month.
Variable Cost Behavior • Variable costs change in total in a time period in direct proportion to the changes in volume. • Because variable costs change in direct proportion to the changes in volume, the cost per unit is constant. • Variable costs are depicted by a sloping line on a graph, indicating that the costs will increase or decrease in proportion to different volume levels.
Variable Cost BehaviorExhibit 3-4 • As Sweet Temptation’s sales volume increases, variable costs increase proportionately.
Total costs = f + v(X) Total Costs Sales Volume Total Cost Behavior • Total costs at any volume are the sum of fixed costs and variable costs at that volume. • The CVP equation for total costs = fixed costs (f) + variable costs per unit (v) times the volume (X).
Total Cost BehaviorExhibit 3-5 • Assuming Sweet Temptation’s fixed costs are $3,850 and variable costs are $4.50 per unit, total costs = $8,350 at a sales volume of 1,000 units. Total Costs = f + v(X) Total Costs = $3,850 + $4.50 (1,000) Total Costs = $8,350
Revenues - Variable Costs - Fixed Costs = Profit Total Expenses Profit Computations • Once the total cost relationship is defined, a company can then project its costs at different levels of sales volume. • The equation for computing net income can be expressed in the following format for CVP analysis:
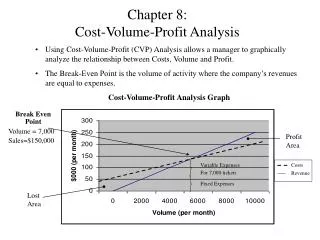
$7,000 $7,000 $0 Revenues - Variable Costs - Fixed Costs = Profit Total Expenses Break-Even Point • Break-even point is the point at which total revenues equal total costs, so there will be no profit or no loss.
Contribution Margin • A key concept in CVP analysis is called “contribution margin.” • Contribution margin equals the difference between estimated total sales revenue and estimated total variable costs.
Contribution Margin • Using CVP analysis, a $6/unit contribution margin can be interpreted as follows: • For every $1 of sales (or increase in sales), a company will earn 60%, or $.60 to contribute to covering fixed costs and operating profit.
Break-even point Contribution Margin • A contribution margin of $6/unit, or 60%, would add $0.60 in operating profit for every additional dollar of sales once fixed costs are covered, as illustrated in the table below.
Selling price/unit X unit sales volume Variable cost/unit X unit sales volume Total fixed costs Revenues - Variable Costs - Fixed Costs = Profit Total Expenses Profit (for a given sales volume) Showing CVP Relationships • With an understanding of contribution margin and fixed costs, CVP analysis can be used to project profit at different levels of sales volume, using the profit equation below:
Unit sales volume = X Simplified, break-even point in units can be defined as: Fixed costs Contribution margin per unit Break-even point in units Calculating Break-Even Point • Assume Sweet Temptations sells boxes of chocolate at $10 per unit. Variable costs are $4.50 per unit and fixed costs are $3,850. How would the break-even point in units be calculated?
Calculating Break-Even Point • By inserting the quantities back into the basic CVP equation, proof is obtained that 700 units equals the break-even point:
Unit sales volume = X Simplified, desired profit point in units can be defined as: Target profit in units Fixed costs + Desired profit Contribution margin per unit Calculating a Desired Profit • Assume Sweet Temptations sells boxes of chocolate at $10 per unit. Variable costs are $4.50 per unit and fixed costs of $3,850. How many units have to be sold to earn a profit of $110?
Calculating a Desired Profit • By inserting the quantities back into the basic CVP equation, proof is obtained that 720 units will generate the desired profit:
Planning with CVP Analysis • Using CVP analysis, a company can project the impact on profits by changing variables. • Assumption 1: Selling price increases but other costs do not change. • Assumption 2: Fixed costs increase but selling price and variable cost do not change. • Assumption 3: Variable costs increase but sales and fixed costs do not change.
How would I calculate break-even point if there is an increase in fixed costs? Reflection
The change in fixed costs would simply be included in the basic CVP equation New break-even point in units Calculating Break-Even Point When Fixed Costs Change • Assume Sweet Temptations sells boxes of chocolate at $10 per unit. Variable costs are $4.50 per unit and fixed costs are $3,850. If fixed costs increase by $1,000, how would the break-even point in units be calculated?