Download
1 / 37
370 likes | 452 Views
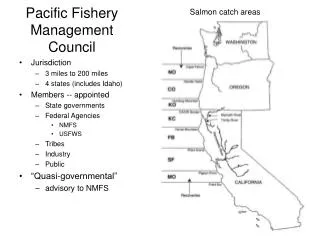
Selected Definitions. A System Dynamics Model of the Pacific Coast Rockfish Fishery. Wayne Wakeland 1 , Olgay Cangur 1 , Guillermo Rueda 1 , Astrid Scholz 2 1 Portland State University, System Science Ph.D. Program 2 Ecotrust. July 24 th , 2003. Agenda. Problem Definition

E N D
Selected Definitions A System Dynamics Model of the Pacific Coast Rockfish Fishery Wayne Wakeland1, Olgay Cangur1, Guillermo Rueda1, Astrid Scholz2 1 Portland State University, System Science Ph.D. Program 2 Ecotrust July 24th, 2003
Agenda • Problem Definition • The Model • Model Testing • Policy Analysis • Analysis and Recommendations • Future Work
The Problem • Populations of Rockfish and other Pacific Coast groundfish dramatically decreased. • OVERCAPITALIZATION is considered the primary cause of fish declination. • The challenge is how to reduce the fleet without painful economic effects.
General Purpose • Model of the dynamics behavior of the Yellowtail Rockfish of the Pacific coast of the US. • Generate “endogenously” the historical data for fish population, fishing vessels, regulatory parameters and fish harvest. • Sensitivity changes to key parameters.
Fishery Pacific Model Selected Definitions • Acceptable Biological Catch (ABC): An estimate of the amount of fish in tons that could be taken from a stock at its current abundance without jeopardizing it. It is calculated by multiplying the harvest fraction that would produce the MSY times the current biomass. • Annual Recruitment: The number of fish that mature and become vulnerable to fishing in a given year. • Maximum Sustainable Yield (MSY): The largest average catch or yield that can continuously be taken from a stock under existing environmental conditions. For species with fluctuating recruitment, the maximum might be obtained by taking fewer fish in some years than in others.
Selected Definitions (cont.) • BMSY:The biomass value that corresponds to MSY. • Stock Assessment and Fishery Evaluation (SAFE): Report that provide historical data on catch and biomass for different species of fish. • Reports: Reports that provide historical data on catch and biomass for various species of fish. • Trawl vessels: Vessels that primarily use trawl gear and account for the majority of groundfish landings (approximately 90%).
Fishery Pacific Model Key Assumptions • Random variation is ignored: Average values from historical information for recruitment rate, spawning, and mortality fish are utilized. • Ecosystem impact: The model assumes that fluctuations in ecological variables impact natural mortality rates that affect stocks by up to 20%. • Vessels: The number of trawl vessels in the model is assumed to be a fraction of the total number of trawl vessels in use. This fraction is computed to represent the equivalent number of trawl vessels that would be present if the vessels were fishing only for yellowtail. • ABC: Acceptable biological catch is calculated yearly in the model, based on triennial biomass surveys. This is the established scientific protocol for stocks assessments, but not always reflected in actual policy.
Fishery Pacific Model Reference Behavior Pattern (RBP) Sebastes flavidus (Yellowtail) Harvest and ABC Historical Data
Fishery Pacific Model The Model – Overall causal loop structure
Fishery Pacific Model The Model – Primary feedback loops
Fishery Pacific Model Model - Trawl Vessel Dynamics • Trawl vessels are modeled as a stock that could increase or decrease over time. • There are not new vessels entry to the fleet. Instead, vessels modify their participation. • New vessels are added to the fleet when are plentiful and removed from the fleet when fish stocks are down. Trawl Vessels= f(supply and demand)
Fishery Pacific Model Model -Fish Population Modeled as two (2) separate stocks, Juveniles and Mature Fish.
Fishery Pacific Model Model –ABC • The PFMC sets ABC based on prescribed rules, the triennial SAFE surveys, and other rules. • ABC = f(Spawner_Percentage)
Fishery Pacific Model Model –Harvest • Harvest = [Current_Capacity – (Restrictions/Density)] • Restrictions = Capacity Difference * Trip Limits Efficiency • Density = Mature to Unfished ratio / Fish Density Coefficient
Fishery Pacific Model Model –Economic Sector • Translate harvest into revenues and profits. • Revenues are accumulative.
Fishery Pacific Model Model –Ocean Health • Exogenous factors from “Disposal Effects and El Niño effects.” • Endogenous effects from “Habitat Health.”
Fishery Pacific Model Model – Historical harvest vs. calculated from the Model
Fishery Pacific Model Model –ABC from the Model vs. historical data
Fishery Pacific Model Model –Trawl vessels over time calculated by the Model
Model Testing • The values of each parameter were varied over a range 50% above and below.
Fishery Pacific Model Testing – Natural Mortality Sensitivity NMR affects Biomass and TGR. Increasing NMR reduces the TGR and significantly impacts the Biomass.
Fishery Pacific Model Testing - Bycatch Sensitivity The model is less sensitivity to Bycatch Rate. Fluctuations differences between the runs are based in the delays in the triennial ABC.
Fishery Pacific Model Testing – Average Vessel Capacity (AVC) Sensitivity The higher the AVC, the longer it takes to reach a sustainable equilibrium. However, the TGR is NOT effected significantly by ABC changes. Biomass is more sensitive than TGR to changes in AVC.
Fishery Pacific Model Testing – Spawner Rate (SR) Sensitivity The model is very sensitive to the parameter SR.
Fishery Pacific Model Testing – Normal Fishing Rate (NFR) Sensitivity The biomass is very sensitive to changes in NPR. But this is not true for TGR, which varies by only a few percent.
Fishery Pacific Model Testing – Effectiveness of Trip Limits (ETL) Sensitivity Higher values of ETL tend to better sustain the environment.
Fishery Pacific Model Testing – Maturation Time Constant (MTC) Sensitivity The model is highly sensitive to MTC. Shorter MTC tends to reinforce MF population, yielding higher TGR. Higher values of MTC result in much lower biomass and TGR.
Fishery Pacific Model Testing – Maturation Time Constant (MTC) Sensitivity The biomass is very high sensitive to changes in MTC.
Fishery Pacific Model Testing – Sensitivity Analysis Summary Table summarizes the results of sensitivity testing
Fishery Pacific Model Testing – Sensitivity test results portrayed graphically
Fishery Pacific Model Policy Analysis– Maximum Sustainable Yield (MSY) The “40-10 Policy” – above 40% is the normal zone; 25%-40% is the precautionary zone; 10%-25% is the protection zone; below 10% is known as extinction zone and no fishing is allowed.
Fishery Pacific Model Policy Analysis– Maximum Sustainable Yield (MSY) How often the ABC is calculated (N= 1, 3 , 5) Results suggested “Policy” for reducing fluctuations in the groundfish fishery.
Fishery Pacific Model Policy Analysis– Management Response Time (MRT) The lower the MRT value, the more quickly MF recovers and returns to the MSY value, suggesting that MRT should be less than five years for best results.
Fishery Pacific Model Future Work • Implementing Economic and Social Factors. • Incorporating dynamic trip limits. • Connecting the economic side of the system to the fishery, trawl vessels, and thus the harvest. • Improving how the model incorporates changes in ocean health. • Considering population dynamic models that include the age, size and weight of fish. • Incorporating Catch per Unit Efficiency (CPUE) index.
Backup slides Backup Information
The Problem – backup slides • Since 1983, groundfish revenues have fallen by 69% and landings of rockfish have decreased 78%. • Catch limits for various species of rockfish have declined 78%-89%. • January 2000 the West Coast groundfish fisheries were declared a federal disaster. Source: (EcoWorld 2000). Return