Multilevel Models in Survey Error Estimation
Multilevel Models in Survey Error Estimation. Joop Hox Utrecht University. mlsurvey. Multilevel Modeling; some terminology/distinctions. Two broad classes of multilevel models Multilevel regression analysis (HLM, MLwiN, SAS Proc Mixed, SPSS Mixed) Multilevel structural equation analysis


Multilevel Models in Survey Error Estimation
E N D
Presentation Transcript
Multilevel Modelsin Survey Error Estimation Joop Hox Utrecht University mlsurvey
Multilevel Modeling;some terminology/distinctions • Two broad classes of multilevel models • Multilevel regression analysis (HLM, MLwiN, SAS Proc Mixed, SPSS Mixed) • Multilevel structural equation analysis (Lisrel 8.5, EQS 6, Mplus) • Which are merging • (Mplus, Glamm)
Multilevel Modeling;some terminology/distinctions • Multilevel Modeling = A statistical model that allows specifying and estimating relationships between variables… • … that have been observed at different levels of a hierarchical data structure • Here mostly examples from multilevel regression modeling
Multilevel Regression Model Lowest (individual) level: • Yij= b0j+ b1jXij+ eij and at the Second (group) level: • b0j= g00+ g01Zj+ u0j • b1j= g10+ g11Zj+ u1j Combining: • Yij= g00 + g10Xij+ g01Zj+ g11ZjXij + u1jXij+ u0j+ eij
The Intercept-Only Model • Intercept only model • (null model, baseline model) • Contains only intercept and corresponding error terms Yij= g00+ u0j+ eij • Gives the intraclass correlation r (rho) • r = s2u0 / (e² + s2u0)
The Fixed Model • Only fixed effects for explanatory variables • Slopes do not vary across groups • Yij= g00+ g10X1ij …gp0Xpij+ u0j+ eij • Intercept variance U0j across groups • Variance component model • Maximum Likelihood estimation, correct standard errors for clustered data
Using the Fixed Modelin Survey Research? • Multiple regression (including logistic) is a powerful analysis system • (Jacob Cohen (1968). Multiple regression as a general data-analytic system. Psychological Bulletin, 70, 426-43.) • Yij= g00+ g10X1ij …gp0Xpij+ u0j+ eij • Multiple regression model but correct standard errors for clustered data • But…, most multilevel software does not correctly handle weights, stratification
Using the Fixed Modelin Survey Research? • Multilevel regression in survey data analysis: a niche product • Individuals within groups • Interviewer & Survey Organization effects • Groups consisting of individuals • Ratings & Measures of Contexts • Occasions within individuals • Longitudinal & Panel data
Individuals within groups • Interviewer & Organization effects • Potentially a three-level structure • Respondents within Interviewers within Organizations Yijk= g000 + g001Xijk+ g010Zjk+ g100Wk + u0k+ u0jk+ eijk • Variance components model
Interviewers in organizations • “I am not selling anything” • Split-run experiment on adding ‘not selling’ argument to standard telephone intro • Multisite study: 10 market research organizations agreed to run experiment in their standard surveys • Data from 101625 cases in 29 surveys within 10 organizations • Predict cooperation rate • Survey-level: experiment, saliency, special pop., nationwide, interview duration, length of intro before ‘not selling’ • Organization level: no predictors, just variance component • Pij= g00 + g01Exp/Conij+ g02X1ij+…+ g06X6ij + u0j (+ eij) De Leeuw/Hox (2004). I am not selling anything: 29 experiments in telephone introductions. IJPOR, 16, 464-473.
Interviewers in organizations across countries • International cooperation on interviewer effects on nonresponse • Data from 3064 interviewers, employed in 32 survey organizations, in nine countries • Interviewer response rate, cooperation rate • Standardized interviewer questionnaire • (translated by organizations) • Standardizing interviewer questionnaire across countries • Not multilevel but multigroup SEM • Confirmatory Factor Analysis shows comparable factors in (translated) questionnaires) Hox/de Leeuw (2002). The influence of interviewers' attitude and behavior on household survey nonresponse: an international comparison. In Groves, Dillman, Eltinge & Little (Eds.) Survey Nonresponse. New York: Wiley.
Predicting response rate • Final multilevel model for interviewer response rates Predictor / Model Null Model Final Model constant 1.25 (.30) .80 (.40) age .01 (.001) sex .05 (.02) experience .01 (.001 soc.val. -.02 (.01) foot in door .01 (.01)ns persuasion .10 (.01) voluntariness -.02 (.01) send other -.01 (.005) ²country .59 (.37) .58 (.36) ²survey .41 (.13) .39 (.12)
Multilevel analysis of Interviewer & Organization Effects • Useful for methodological research • Standard multilevel regression • Response rates: logistic regression • Estimation issues • Discussed in Goldstein (2003), Raudenbush & Bryk (2004), Hox (2002) • Currently best method • Hox, de Leeuw & Kreft 1991; Hox & de Leeuw 2002; Pickery & Loosveldt 1998, 1999; Campanelli & O’Muircheartaigh 1999, 2002; Schräpler 2004;
Groups consisting of individuals • Measuring contextual characteristics • Aggregation: characterizing groups by summarizing the scores of individuals in these groups • Contextual measurement: let individuals within groups rate group or environment characteristics • What are the qualities of such ratings?
Measuring contextual characteristics • Example: use pupils in schools to rate characteristics of the school manager • 854 pupils from 96 schools rate 48 male + 48 female managers • Variables: six seven-point items on leadership style • Two levels: pupils within schools • Pupils are informants on school manager • Pupil level exists, but is not important
Measuring contextual characteristics • Pupils in schools rate school managers • Two levels: pupils within schools • Analysis options • Treat as two-level multivariate problem • Multilevel SEM (Mplus, Lisrel, Eqs) • Treat as three-level problem with levels variables, pupils, schools • Multilevel regression (HLM, MLwiN)
Measuring the context with multilevel regression • Three levels: variables, pupils, schools • Intercept only model: • Estimates: • Intercept 2.57 • s2school = 0.179, s2pupil = 0.341, s2item= 0.845
Measuring the context:Interpretation of estimates • Intercept 2.57 • Item Mean across items, pupils, schools • s2school = 0.179 • Variation of item means across schools • s2pupil = 0.341 • Variation of item means across pupils • s2item= 0.845 • Item variation (inconsistency)
Measuring the context:Reliability of measurement • Decomposition of total variance over item, pupil & school level • Pupil level reliability • Consistency of pupils across items • Idiosyncratic responses, unique experience • apupil = s2pupil /(s2pupil + s2item /k) • apupil = 0.71
Measuring the context:Reliability of measurement • Decomposition of total variance over item, pupil & school level • School level reliability • Consistency of pupils about manager • aschool = 0.77
Measuring the Context:Increasing reliability • School level reliability depends on • Mean correlation between items • Intraclass correlation for school • Number of items k • Number of pupils nj • a goes up fastest with increasing nj
Measuring the context: Combining information • Assume school managers are rated on these 7 items by pupils and themselves • Three levels: items, pupils, schools • Two dummy variables that indicate pupil & self ratings • Variances • item (1), pupil (1), school (2 + cov) Rating covariance (validity) Manager variance (systematic) Item variance (error) Pupil variance (bias)
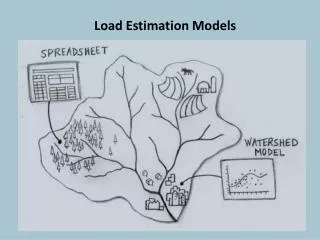
Example: Measuring neighborhood characteristics • Neighborhoods & Violent Crime • Assessment of neighborhoods • 343 neighborhoods • ± 25 respondents per neighborhood interviewed & rated own neighborhood (respondent level) • Ratings aggregated to neighborhood level • Census information on neighborhood added Sampson/Raudenbush/Earls (1997). Neighborhoods and violent crime: A multilevel study of collective efficacy. Science, 277, 918-924.
Example: Measuring neighborhood characteristics • Ratings aggregated to neighborhood level • At lowest level demographic variables of respondents added to control for rating bias due to different subsamples • Neighborhood ratings aggregated conditional on respondent characteristics Yijk= g000 + g001Xijk+ u0k+ u0jk+ eijk • Intercept-only + individual covariates
Occasions within individuals • Six persons on up to four occasions • Lowest level: occasion; Second: person • Mix time variant (occasion level) and time invariant (person level) predictors • Time: trend covariate (1, 2, 3…) or occasion dummies (0/1) • Missing occasions are no problem
Longitudinal data:Occasion level • Occasion level, time indicator T • Yti = p0j + p1jTti + etj • Intercept and slope coefficients vary across the persons • They are the starting points and rates of change for the different persons • Use p for occasion level coefficient, and t for the occasion subscript • On person level we have again b and i
Longitudinal data:Multilevel model • Occasion level:Time varying covariates • Yti = p0i + p1i Tti + p2jXti + etj • Person level: time invariant covariates • p0j = b00 + b01 Zi + u0i • p1j = b10 + b11 Zi + u1i • p2j = b20 + b21 Zi + u2i • T time-points, at most T-1 time varying predictors • Or T time varying predictors and no intercept
Longitudinal data:NLSY Example • Subset of National Longitudinal Survey of Youth (NLSY) • 405 children within 2 years of entering elementary school • 4 repeated measurement occasions • Child’s antisocial behavior and reading recognition skills • 1 single measure at 1st occasion • Mother’s emotional support and cognitive stimulation
NLSY Example: Linear Trend • Multilevel regression model for longitudinal GPA data • No ‘intercept-only’ model, start with a model that includes time • Occasion fixed • Antisoctj = b00 +b10Occti+ u0i+ eti • Occasion random • Antisoctj = b00+ b10Occti+ u1iOccti+ u0i+ eti • Different individual trends over time
ComplexCovariance Structures • Standard model for longitudinal data • Occasion random: Antisoctj = b00+ b10Occti+ u1iOccti+ u0i+ eti • Variance components: se2 and s002 • Assumes a very simple error structure • Variance at any occasion equal to se2 + s002 • Covariance between any two occasions equal to s002 • Thus, matrix of covariances between occasions is
ComplexCovariance Structures • Multivariate multilevel model • No intercept, include 6 dummies for 6 occasions • No variance component at occasion level • All dummies random at individual level • Equivalent to Manova approach to repeated measures • Covariance matrix: • Add occasion, fixed
ComplexCovariance Structures • Restricted model for longitudinal data • Specific constraints on covariance matrix between occasions • Example: assume that autocorrelations between adjacent time points are higher than between other time points (simplex model) • Example: assume that autocorrelations follow the model et = r et-1 + e • Add occasion, fixed or random
NLSY Example: Linear trend, Complex covariance structure • Occasion fixed, unrestricted covariance matrix across occasions • Occasion fixed, covariance matrix autocorrelation structure • Occasion random, covariance matrix autocorrelation structure
NLSY Example:Results linear trend, fixed part Linear trend + random slope model deviance 5318.12 with 8 less parameters c2=14.2, df=8, p=0.08 Far worse than unconstrained model c2=97.7, df=8, p<0.0001
Advantages of Multilevel Modeling Longitudinal Data • Missing occasion data are no problem • Manova = listwise deletion, which wastes data • Manova = Missing Completely At Random (MCAR) • Multilevel model = Missing At Random (MAR) • Can be used for panel & growth models • Rate of change may differ across persons, and predicted by person characteristics • Easy to extend to more levels (groups)
References for Multilevel Analysis • J.J. Hox, 1995. Applied Multilevel Analysis. (http://www.fss.uu.nl/ms/jh) (introductory) • J.J. Hox, 2002. Multilevel Analysis. Techniques and Applications. Hillsdale, NJ: Erlbaum. (intermediate) T.A.B. Snijders & R.J. Bosker (1999). Multilevel Analysis. Thousand Oaks, CA: Sage. (more technical) H. Goldstein (2003). Multilevel Statistical Models. London: Arnold Publishers. (very technical)