Download
1 / 45
450 likes | 603 Views
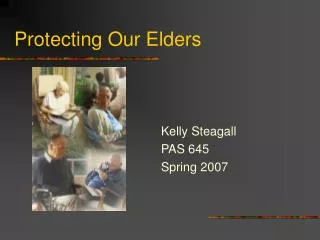
Protecting the Health of Our Elders. Kathy Sykes, Senior Advisor, EPA Aging Initiative Theodore Coopwood Intergenerational Coordinator Office of Children’s Health Protection . Ancient American Indian Proverb.

E N D
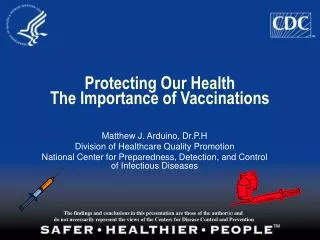
Protecting the Health of Our Elders Kathy Sykes, Senior Advisor, EPA Aging Initiative Theodore Coopwood Intergenerational Coordinator Office of Children’s Health Protection
Ancient American Indian Proverb “Treat the earth well: It was not given to you by your parents, it was loaned to you by your children. We do not inherit the Earth from our ancestors; we borrow it from our children.”
In 2000, 35 M 65+ 4.2 M 85+ By 2030, 71.5M 65+ 9.6 M 85+ 85+ fastest growing age cohort Demographic Shift: Growing Aging Population in USA Source: US Census 2004
Facts about Women and Children • “By the year 2010, almost half of all women will be at least 50 years old.”1 • “ An increasing number of older people are providing care for grandchildren and great-grandchildren.”2 • “Baby Boomers can expect to spend more years caring for older family members than caring for children.” 2 1 National Policy and Resources Center on Women and Aging at Brandeis University 2 Grantmakers in Aging “A Tool Kit Funding Across Ages”
National Agenda for the Environment and the Aging • Identify research gaps in environmental health • Translate research findings into public health prevention strategies 3. Create tools to address the impact a rapidly aging society will have on the environment 4. Provide opportunities for older adults to become environmental stewards in their communities
Why Focus onOlder Adults? • Decrease in organ function & reserves • Impaired chemical clearance and detoxification • Vulnerable to medication-environment adverse interactions (example - heat/psychotropic drugs) • Legacy of past occupational and environmental cumulative exposures to persistent agents.
Poison Control Center Data 1993-1998 • Older adults accounted for a small percentage of poison control center reported incidents (2.8%). • However, they accounted for 5.9% of all cases with a moderate to major medical outcome and 28% of the deaths. Source: Dr. Jerry Blondell OPPTS, EPA
PM a Major Public Health Risk • Diabetes ~ 60,000 people die annually in the US • End-stage Renal Disease: ~ 60,000 deaths/yr • Particle Pollution: ~ 60,000 deaths/yr Source: Wayne E. Cascio, MD, Professor of Medicine and Chief, Division of Cardiology, Brody School of Medicine, East Carolina University
WHO Estimates of Premature Death Due to Air Pollution • In 1995, WHO estimated that 460,000 avoidable deaths occur annually as a result of suspended particulate matter. • In 1997, WHO and others estimated that each year, nearly 700,000 deaths are related to air pollution. • About 8 million avoidable deaths will occur worldwide by 2020.
Ozone and Particulate Matter (PM) • Ozone & PM have the greatest potential to affect the health of older adults. • PM is linked to premature death, cardiac arrhythmias, heart attacks, asthma attacks, and development of chronic bronchitis.
1998 Baseline 1999 2000 2010 Target Hospitalizations for asthma, 1998-2000 Hospitalizations per 10,000 population Total Black White Total Black White Total Black White Persons 5 to 64 years* Persons 65 and older* Children under 5 years I = 95% confidence interval Note: *Data are age adjusted to the 2000 standard population. Data for Hispanics, American Indians, Alaska Natives, Asians and Pacific Islanders are unreliable. Obj. 24-2 a, b, c Source: National Hospital Discharge Survey (NHDS), CDC, NCHS
Asthma deaths by age, 1999-2000 Deaths per 1,000,000 population 1999 2000 2010 Target 5-14 15-34 65 and over Under 5 35-64 Years of age Obj. 24-1 a-e Source: National Vital Statistics System, CDC, NCHS.
2010 Target Activity limitations among persons with asthma, 1994-96 Age-adjusted percent Black White Hispanic Poor Near poor Middle/ high Total Female Male Not Hispanic Family income NOTE: Data are age adjusted to the 2000 standard population. Obj. 24-4 Source: National Health Interview Survey (NHIS), CDC, NCHS
More than 70% Could Better Manage Asthma Triggers • Only 30% of US pop. with asthma are taking simple steps to reduce exposure to asthma triggers. • Exposure to asthma triggers such as second hand smoke, cockroaches, dust motes, mold, and ozone can set off asthma attacks. Source: US EPA survey
Who is at Risk from Extreme Heat? • Older adults and young children are at high risk. • Living alone or being confined to a bed and unable to care for one’s self increases risk. • Chronic illness, mental impairment or obesity are also risk factors.
Heat-Related Mortality --- Arizona, 1993--2002, and United States, 1979--2002
Intergovernmental Panel on Climate Change Predicts • Increases in frequency and duration of Extreme Heat Events (EHE) • Increases in urbanization and heat island effects • Trend: increase in % of US population over 65 yrs • Trend: More people living alone
Gastrointestinal Illness in the U.S. • 211 million episodes of acute gastrointestinal illness occur each year in the US. • Result in more than 900,000 hospitalizations & 6,000 deaths (Mead 1999). • Many of these cases may be of infectious origin due to food or waterborne transmission. Slide provided by : Jack Colford, UC Berkley
Burden of Waterborne Disease Studies have found that 1/3 of GI illness cases are related to drinking water, suggesting that up to 70 million cases of GI illness may be caused by waterborne pathogens. Source: Payment 1991 & 1997
Older Adults at Increased Risk for GI Older adults may be at increased risk for infectious GI illness, severe diarrhea, or dying from diarrheal illness. Source: Peterson 2003, Mounts 1999, Gerba 1996, Lew 1991
Bacterial and Viral Enteric Diseases as Contributing Causes of Death by Age, 1989 - 1996 Viral ’89-90 ’91-’92 ’93-’94 ’95-’96 Bacteria ’89-90 ’91-’92 ’93-’94 ’95-’96
Hospitalizations and Deaths • Highest rates of death related to entericdisease are seen among people older than 75 years. • Deaths related to bacterial enteric disease in older adultsare increasing at a greater rate than in any other age category Source: Peterson2003
EPA’s Drinking Water Hotline (800) 426-4791 http://www.epa.gov/safewater/faq/
Building Healthy Communities for Active Aging • Raise awareness in communities about the importance of Smart Growth and Physical Activity for older adults. • Communities will have the opportunity to assess themselves. Cities, counties and tribes.
Built Environment • Developments where we live, work, shop and play has direct and indirect effects on the natural environment • Where and how we develop directly impacts natural resource areas and wildlife habitat an replaces natural cover with impervious surfaces such as concrete or asphalt.
Provide environmental benefits Less air pollution Less water pollution Less sprawl Less traffic More open space Promote physical activity More opportunities to walk More bike lanes Better access to parks, trails, and recreational areas Smart Growth can Build Healthy Communities
Benefits of Physical Activity and Costs of Inactivity • 38% of Americans age 55 + is sedentary • 50% of women age 75+ engage in no physical activity • Regular physical activity reduces risk of coronary heart disease, risk for stroke, colon cancer, diabetes, and high blood pressure by 30-50% Source: CDC
% 65+ Engaging in Physical Activity 2003-2004 • 22% of population 65+ reported engaging in regular physical activity • The percentage engaged in physical activity drops off at older ages 30.5% 45-64 27.5% 65-74 19.4% 75-84 8.6% 85+ Source: NHIS- (civilian non-institutionalized pop.) Federal Interagency Forum on Aging Related Statistics. Older Americans 2006: Key Indicators of Well-Being. Washington, DC:
Supporters of BHCAA AARP Active for Life (AFL) America Walks The Administration on Aging (AoA) The American Medical Association (AMA) The American Public Health Association (APHA) The Atlanta Regional Commission (ARC) The American Society on Aging (ASA) The Council of State and Territorial Epidemiologists (CSTE) Generations United (GU) The Gerontological Society of America (GSA) The Healthy Aging Research Network (HAN) The International City/County Management Association(ICMA) The International Council on Active Aging (ICAA) The Local Government Commission (LGC) The Milton H. Erickson Foundation, Inc. The National Association of Area Agencies on Aging(n4a) The National Blueprint Initiative The National Council on Aging (NCOA) The National Indian Council on Aging (NICOA) The National Recreation and Park Association (NRPA)
"Every human has a fundamental right to an environment of quality that permits a life of dignity and well-being” United Nations Conference on the Human Environment, Stockholm
Fact Sheets www.epa.gov/aging • Age Healthier, Breathe Easier • Effective Control of Household Pests • It’s Too Darn Hot--Planning for Excessive Heat Events • Environmental Hazards Weigh Heavy on the Heart • Water Works Translations Spanish, Portuguese, Chinese, Korean, Vietnamese, Russian, Italian, French, Japanese, Arabic, & Haitian Creole Purple Series: For those with limited reading ability
Aging Initiative List Serve Join the EPA Aging Initiative List serve for monthly updates www.epa.gov/aging • Funding opportunities: http://www.epa.gov/osp/tribes/announce/fund.htm Kathy Sykes sykes.kathy@epa.gov (202) 564-3651
Ecological Footprint Ecological Footprint is a resource management tool. It measures how much land & water area a human population requires to produce the resources it consumes and to absorb its wastes, taking into account prevailing technology.
Ecological Footprint • Humanity’s footprint is 20% larger that what the planet can regenerate. It takes more than a year and two months for the Earth to regenerate what we use in a single year. • http://www.myfootprint.org/