Download
1 / 22
220 likes | 383 Views
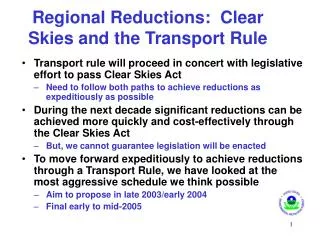
Clear Skies and Other Multi-Pollutant Bills. Outlook for the West. Sam Napolitano Clean Air Markets Division Presentation to Westar Business Meeting September 18, 2003. Regional Haze. Despite Progress, Air Quality Problems Persist.

E N D
Clear Skies and Other Multi-Pollutant Bills Outlook for the West Sam Napolitano Clean Air Markets Division Presentation to Westar Business Meeting September 18, 2003
Regional Haze Despite Progress, Air Quality Problems Persist • Smog and fine particles associated with lung and heart effects, including: • Premature death • Bronchitis • Asthma attacks Air Toxics, Especially Mercury Deposition Acid Rain and Nitrogen Deposition
Miscellaneous Power Plants Are Significant Contributors to These Public Health and Environmental Challenges Nitrogen Oxides Sulfur Dioxide Electric Power (22%) Electric Power (63%) Mercury Electric Power (37%) Electric power Industrial Processing Transportation Other stationary combustion * * Other stationary combustion includes residential and commercial sources.
Current Clean Air Act Requirementsfor Power Sector Further progress under the Clean Air Act is complex, burdensome and uncertain NSR Permits for new sources & modifications that increase emissions Note: Dotted lines indicate a range of possible dates. 1 Further action on ozone would be considered based on the 2007 assessment. 2 The SIP-submittal and attainment dates are keyed off the date of designation; for example, if PM or ozone are designated in 2004, the first attainment date is 2009 EPA is required to update the new source performance standards (NSPS) for boilers and turbines every 8 years 8-hr Ozone Attain- ment Demon- stration SIPs due Designate areas for 8-hr Ozone NAAQS 1-hr Severe Area Attainment Date Marg-inal 8-hr Ozone NAAQS Attain-ment Date Assess Effectiveness of Regional Ozone Strategies Moderate 8-hr Ozone NAAQS Attainment Date Ozone 1-hr Serious Area Attainment Date NOx SIP Call Red-uc-tions Possible Regional NOx Reductions ? (SIP call II)1 OTC NOx Trading NOx SIPs Due Serious 8-hr Ozone NAAQS attainment Date 04 06 07 08 09 10 12 13 15 16 17 18 05 00 01 02 03 11 14 99 Compliance for BART Sources Mercury Determination Proposed Utility MACT Final Utility MACT Compliance with Utility MACT Compliance for BART sources under the Trading Program Second Regional Haze SIPs due New Fine PM NAAQS Implementation Plans Designate Areas for Fine PM NAAQS Latest attainment date for Fine PM NAAQS 3 Phase II Acid Rain Compliance Interstate Transport Rule to Address SO2/ NOx Emissions for Fine PM NAAQS and Regional Haze In developing the timeline of current CAA requirements, it was necessary for EPA to make assumptions about rulemakings that have not been completed or, in some case, not even started. EPA’s rulemakings will be conducted through the usual notice-and-comment process, and the conclusions may vary from these assumptions. Regional Haze SIPs due Acid Rain, PM2.5, Haze, Toxics
Why Multi-Pollutant Legislation? • Air quality has improved, but our best science says health and environmental problems persist. • Current path to improved air quality is complex. • Multi-Pollutant approach addresses power industry pollution with a proven approach – emissions cap and trade: • Simpler and more certain -- for regulators, industry, and citizens. • More flexible and cost effective -- allows for strategic planning of capital (i.e., avoided stranded investment) and cobenefits from control technologies (i.e., mercury removal). • Greater environmental improvement sooner via faster emission reductions than under current CAA regulations. • For good reasons, Clear Skies remains one of the highest environmental priorities of the President.
Program Elements What to Control Timing Level Type of Control Program Objectives Air Quality Improvement Attainment Public Health Environment Reasonable Impacts Production Cost Fuel Use Effective Implementation Installation Pace Technology Improvement What Can Pass? Many Issues Addressed Along the Way Aim: To Strike the Right Balance…
Why Is Multi-Pollutant Legislation Important to the West? The West Will Continue to Grow... • Population is projected to grow more than 20% from current levels by 2020 • Electricity demand is expected to grow more than the national average • More than 10% over national average in the Pacific States • More than 30% over national average in the Mountain States ...While the Environment Is Protected • Legislation would protect air quality by lowering or halting increases in air emissions throughout the West from today’s levels: • Prevent degradation of visibility in parks. • Help counties remain in attainment with health-based air quality standards, reducing the burden on state and local governments. • Ensure nitrogen deposition does not increase and reduce mercury deposition.
Current Emissions Phase 1 Cap Phase 2 Cap Reductions at Full Implementation SO2 (tons) 11 million 4.5 million (2010) 3 million (2018) 73% NOx(tons) 5 million 2.1 million (2008) 1.7 million (2018) 67% Mercury (tons) 48 26 (2010) 15 (2018) 69% Clear Skies’ Caps and Timing
Recognition of Western Programs and Concerns WRAP States included in SO2 Emissions Target • Clear Skies Act (CSA) supports and codifies the Western SO2 emission target established by the Western Regional Air Partnership (WRAP). • Clear Skies creates two trading zones for NOx: • States in Zone 1 have ozone/PM2.5 non-attainment issues or contribute to other States’ problems. • Zone 2 includes: • WRAP States: AZ, CA, CO, ID, MT, NM, ND, • OR, SD, UT, WA, WY. • NV,OK, KS, and NE • Western portion of TX Zone 2 Zone 1
SO2 Emissions Reductions under Clear Skies in 2020 Note: The base case in IPM includes Title IV, the NOx SIP Call, NSR settlements, and state-specific caps in CT, MA, MO, NC, NH, TX, and WI. It does not include mercury MACT in 2007 or any other potential future regulations to implement the current Clean Air Act. Base case emissions in 2020 will likely be lower due to state and federal regulatory actions that have not yet been promulgated. Emissions projected for new units in 2020 are not reflected.
NOx Emissions Reductions under Clear Skies in 2020 Note: The base case in IPM includes Title IV, the NOx SIP Call, NSR settlements, and state-specific caps in CT, MA, MO, NC, NH, TX, and WI. It does not include mercury MACT in 2007 or any other potential future regulations to implement the current Clean Air Act. Base case emissions in 2020 will likely be lower due to state and federal regulatory actions that have not yet been promulgated. Emissions projected for new units in 2020 are not reflected.
Costs & Other Impacts Annual cost of $1.2 billion Electricity price increases of: Rocky Mountain, Pacific NW and TX: 1% CA: .4% OK and KS: 2.1% Northern Tier and Plains States: 3.5% Two coal-fired units at different plants may close Coal production at 2000 levels with new mix in the West Small natural gas impacts Benefits Quantifiable benefits of about $9.5billion ($8.6 billion for health) Additional unquantified health & environmental benefits Flexibility and certainty Fuel diversity preserved Room for growth *Includes states in Clear Skies Zone 2 for NOx:-- ND, SD, NE, KS, OK, TX, MT, WY, CO, NM, AZ, NV, UT, ID, WA, OR, and CA. Western Impacts of Clear Skies* 2020 At-A-Glance
2010 2020 6,000 6,000 5,000 5,000 4,000 4,000 TWh TWh 3,000 3,000 2,000 2,000 1,000 1,000 - - Base Case Clear Skies Base Case Clear Skies Coal Oil/Gas Nuclear Other Hydro Coal Oil/Gas Nuclear Other Hydro National Picture: CSA Controls and their Economic Impact Coal- Fire Capacity with Scrubbers Increases (GW) Coal- Fire Capacity with SCR Increases (GW) Coal- Fired Capacity with ACTss Ssmall (GW) Small Changes in Generation Mix Annual Costs Gradually Rise National Electricity Price Increases Modestly Natural Gas & Coal Prices Do Not Change Much Shift Occurs in Coal Production
Counties likely to Exceed the Annual Ozone standard with Clear Skies in 2020 Remaining Counties Likely to Exceed the Annual Fine Particle Standard with Clear Skies in 2020 National Picture: Air Quality, Health, & Environmental Gains • 2020 Benefits that EPA Can Value in Dollars: • Health benefits are approximately$110 billionannually . • An alternative estimate is $21 billion. • Each year, there are: • 14,100 fewer premature deaths; • An alternative estimate: 8,400 fewer premature deaths. • 8,800 fewer cases of chronic bronchitis; • 23,000 fewer non-fatal heart attacks; • 30,000 fewer hospitalizations/emergency room visits for cardiovascular & respiratory symptoms; • includes 15,000 fewer hospital and emergency room visits for asthma. • 12.5 million fewer days with respiratory illnesses and symptoms, • includes work loss days (1.6 million), restricted activity days (10.3 million), and school absences (200,000). • Includes hundreds of thousands fewer respiratory symptoms and 180,000 fewer asthma attacks. • Annual visibility benefits of $3 billion in selected Natl Parks and Wilderness areas. • Significant decreases in fine particles and ozone occur before the existing Clean Air Act can provide them. Visibility Improves Sulfur Deposition Drops • Many benefits are not valued in dollars, but are important: • -Other visibility improvements • - Mercury deposition reduction • - Sulfur deposition reduction • - Nitrogen deposition reduction • - Other health improvements Nitrogen Deposition Drops Mercury Deposition Drops
Comparison of Caps and Timing: Clean Air Planning Act, Clear Skies Act, and Clean Power Act
Comparison of Other Provisions:Clear Air Planning Act, Clear Skies Act, and Clean Power Act
Comparison of Other Provisions:Clean Air Planning, Clear Skies Act, and Clean Power Act (cont.)
Graphic Comparison of Proposed Multi-Pollutant Control Levels: Sulfur Dioxide
Graphic Comparison of Proposed Multi-Pollutant Control Levels: Nitrogen Oxides
Graphic Comparison of Proposed Multi-Pollutant Control Levels: Mercury
The Opportunity before Us • Enactment of the Clear Skies Act has many advantages to all stakeholders: • Immediate and long-term health and environmental benefits • Less burden on State and local governments • Lower costs for industry and consumers • The 108th Congress has a unique opportunity to reduce the electric power industry’s emissions and improve the cost-effectiveness of environmental policy. • The Administration is committed to working with Congress to pass the Clear Skies Act.
For Additional Information SeeClear Skies Websitewww.epa.gov/clearskies