Download
1 / 72
790 likes | 1.13k Views
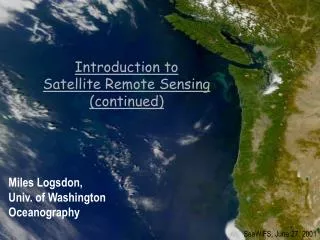
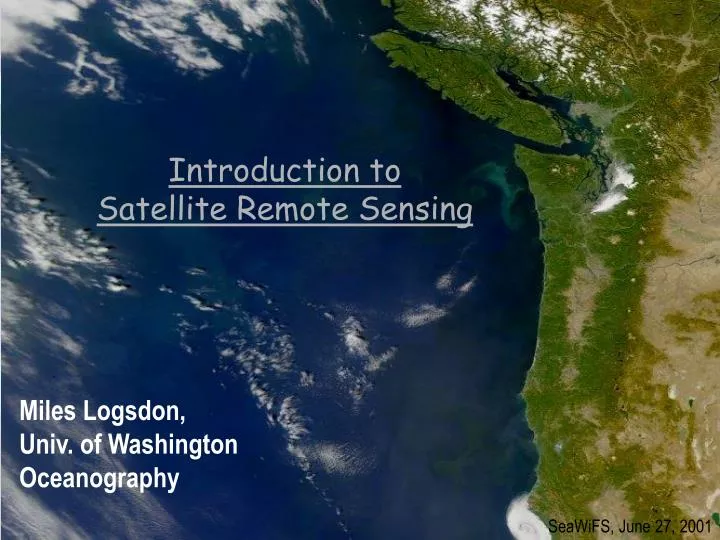
Introduction to Satellite Remote Sensing. Miles Logsdon, Univ. of Washington Oceanography. SeaWiFS, June 27, 2001. My agenda. Show you pretty pictures Introduce Remote Sensing terms and concepts Get the language down “Think” about the future. Acknowlegements!!.

E N D
Introduction to Satellite Remote Sensing Miles Logsdon, Univ. of Washington Oceanography SeaWiFS, June 27, 2001
My agenda • Show you pretty pictures • Introduce Remote Sensing terms and concepts • Get the language down • “Think” about the future
Acknowlegements!! • Mark Abbott: Oregon State University • MODIS highlights, data, and images • Seely Martin: University of Washington • Illustrations, and explanations • Robin Weeks: University of Washington • Graphics and data • Leon Delwiche: University of Washington • Illustrations Most of what you see here is explained better by these people
What is Remote Sensing and Image Classification? • Remote Sensing is a technology for sampling radiation and force fields to acquire and interpret geospatial data to develop information about features, objects, and classes on Earth's land surface, oceans, and atmosphere (and, where applicable, on the exterior's of other bodies in the solar system). • Remote Sensing is detecting and measuring of electromagnetic energy (usually photons) emanating from distant objects made of various materials, so that we can identify and categorize these object by class or type, substance, and spatial distribution • Image Classification has the overall objective to automatically categorize all pixels in an image into classes or themes. The Spectral pattern, or signature of surface materials belonging to a class or theme determines an assignment to a class.
Specifically, we measure radiation produced in three ways:1. Emitted from the surface (thermal IR)2. Reflected from the surface (solar)3. Reflected from energy pulses directed at the surface (RADAR)
Path 47 Row 26 & 27 8/2/98 Path 46 Row 26 & 27 8/27/98 Landsat-ETM 30m resolution 16-day repeat
MODIS Terra - Daytime Descending Orbits MODIS 1k resolution Daily repeat Best response in a Ph.d. oral exam: “I’ll give up space to get time”. Miles Logsdon
A second “goal” might be to produce a: Derived Product MOD13 – NDVI (16-day) 500m resolution June 2002 Low High (“bright” photosynthesizing vegetation)
MOD11 – Daytime (8-day averaged) Land Surface Temperature June 2002 ~3o C ~50o C Temperature (oC)
Current Collections Pacific Northeast, Apr – Sep, 1999 - 2003 Remote Sensing as a Time Series SeaWifs, 1999, 1km monthly mean chlorophyll-a estimates Apr May Jun Jul Aug Sep
Subtractive Additive
First: A few Simple Reminders about Spectral Signatures Thanks to Robin Weeks
Coordinate system used with satellite sensors qZ Zenith angle q Look or incidence angle qS Solar zenith angle
When radiation interacts with the atmosphere, then depending on the wavelength, the three things that happen are - Absorption, - Scattering, - Emission.
The Effect of the Atmosphere on Spectral Data Path Radiance (Lp) Atmospheric Transmissivity (T) Thanks to Robin Weeks
ScatteringThere are two kinds of scattering,Rayleigh or molecular scatter, which only matters in the visible; andMei or aerosol scatter (scatter from raindrops, sulfuric acid droplets, salt particles) which matter at much longer wavelengths.
Two kinds of solar reflection in the visible: Direct surface reflection, diffuse sub-surface backscatter
Once the Light “hits” the surface we are concerned with reflection
Terrestrial and Ocean Color Sensors Ocean Color Sensors
Band Combinations R G B Landsat band 5 4 3 2 1 R,G,B 3,2,1 R,G,B 4,3,2 R,G,B 5,4,3
We “approach” RS in two ways • To classify or group thematic land surface materials • To detect a biophysical process
Dimensionality N = the number of bands = dimensions …. an (n) dimensional data (feature) space Measurement Vector Mean Vector Feature Space - 2dimensions 190 85 Band B Band A
Spectral Distance * a number that allows two measurement vectors to be compared
Classification Approaches • Unsupervised: self organizing • Supervised: training • Hybrid: self organization by categories • Spectral Mixture Analysis: sub-pixel variations.
Clustering / Classification • Clustering or Training Stage: • Through actions of either the analyst’s supervision or an unsupervised algorithm, a numeric description of the spectral attribute of each “class” is determined (a multi-spectral cluster mean signature). • Classification Stage: • By comparing the spectral signature to of a pixel (the measure signature) to the each cluster signature a pixel is assigned to a category or class.
terms • Parametric = based upon statistical parameters (mean & standard deviation) • Non-Parametric = based upon objects (polygons) in feature space • Decision Rules = rules for sorting pixels into classes
Unsupervised ClusteringMinimum Spectral Distance ISODATA I - iterative S - self O - organizing D - data A - analysis T - technique A - (application)? Band B Band A Band B Band A 1st iteration cluster mean 2nd iteration cluster mean
Classification Decision Rules • If the non-parametric test results in one unique class, the pixel will be assigned to that class. • if the non-parametric test results in zero classes (outside the decision boundaries) the the “unclassified rule applies … either left unclassified or classified by the parametric rule • if the pixel falls into more than one class the overlap rule applies … left unclassified, use the parametric rule, or processing order • Non-Parametric • parallelepiped • feature space • Unclassified Options • parametric rule • unclassified • Overlap Options • parametric rule • by order • unclassified • Parametric • minimum distance • Mahalanobis distance • maximum likelihood
cluster mean Candidate pixel Parallelepiped • Maximum likelihood • (bayesian) • probability • Bayesian, a prior (weights) Band B Band A Minimum Distance Band B Band A
Classification Systems USGS - U.S. Geological Survey Land Cover Classification Scheme for Remote Sensor Data USFW - U.S. Fish & Wildlife Wetland Classification System NOAA CCAP - C-CAP Landcover Classification System, and Definitions NOAA CCAP - C-CAP Wetland Classification Scheme Definitions PRISM - PRISM General Landcover King Co. - King County General Landcover (specific use, by Chris Pyle) • Level • 1 Urban or Built-Up Land • 11 Residential • 12 Commercial and Services • 13 Industrial • 14 Transportation, Communications and Utilities • 15 Industrial and Commercial Complexes • 16 Mixed Urban or Built-Up • 17 Other Urban or Built-up Land • 2 Agricultural Land • 21 Cropland and Pasture • 22 Orchards, Groves, Vineyards, Nurseries and Ornamental Horticultural Areas • 23 Confined Feeding Operations • 24 Other Agricultural Land
Detecting a Process: Two examples Using “band math”