Download
1 / 29
300 likes | 596 Views
Ch. 7 Assignment due Feb 11(Mon), 11.59pm. Chapter 7: Cost-Volume-Profit (Part 3 of 3). Sections 1 and 2 Feb 8, 2013 Professor: Khim Kelly Office: HH386B Office Hours: Mon/Wed 11:30am – 12:30pm and Appointment Email: kokelly@uwaterloo.ca TA : Kun Huo Email : khuo@uwaterloo.ca.

E N D
Ch. 7 Assignment due Feb 11(Mon), 11.59pm Chapter 7: Cost-Volume-Profit (Part 3 of 3) • Sections 1 and 2 • Feb 8, 2013 • Professor: Khim Kelly • Office: HH386B • Office Hours: Mon/Wed 11:30am – 12:30pm and Appointment • Email: kokelly@uwaterloo.ca • TA: Kun Huo • Email: khuo@uwaterloo.ca • Kun will be teaching Ch. 7 expect mass confusion
8 Feb 2013 Overview • Last lecture … • More break-even analysis • Margin of Safety analysis • Target operating profit analysis • Today’s lecture … • Cost Structure Choice and Leverage • Indifference analysis • Multi-product Settings
Cost structure choice • Company can choose a particular cost structure (i.e., relative proportion of fixed and variable costs) • Which cost structure is better (more fixed costs or more variable costs)? • Depends on many factors • Concept of leverage plays a key role in the analysis
“Give me a place to stand and with a lever I will move the whole world”
Operating Leverage • Measure of the sensitivity of OI to % change in sales • Acts as a multiplier • Higher leverage: small change in sales leads to larger shift in OI • Differs at any level of sales (i.e. valid at given X only), greatest at break-even point and decreases as sales increases • Cost structure drives leverage • More FC rather than VC yields greater leverage • Drive to automation? CM Degree of Operating Leverage = OI
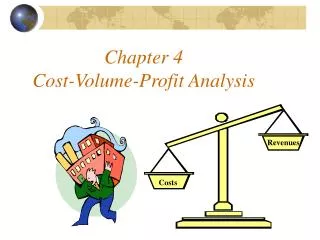
Leverage Graph: Cost Structure Total Sales Revenue Case A: Total Expenses $ Break-even Point Case B: Total Expenses High FC Lower FC results in a lower break-even point (Fixed expenses/unit CM), so less risk of losses when sales decrease Low FC Activity
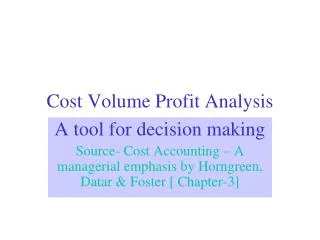
Leverage Graph: Cost Structure Total Sales Revenue Which has a greater degree of operating leverage at point X: A or B? $ Case A: Total Expenses X Case B: Total Expenses Higher FC (higher CM) results in higher leverage (CM/OI), so better upside potential in profits when sales increases High FC Low FC Activity
Operating Leverage Example 1 CM Degree of Operating Leverage = OI Sales increase by 10% OI increases by 4 times (i.e., 40%)
Operating Leverage Example 2 CM Degree of Operating Leverage = OI Same total sales Same total expenses, but greater proportion of FC Sales increase by 10% OI increases by 7 times (i.e., 70%) Higher FC (higher CM) results in higher leverage (CM/OI), so better upside potential in profits when sales increases
The critical assumption about leverage • As fixed cost increases, variable cost will come down • More roads and infrastructure, people are more productive because they spend less time on the travel • Bigger class rooms, fewer instructors need to be hired
It is Clicker Time!! Feel Free to Work Together on Clicker Questions
Clicker Question #1 Green Company's variable expenses are 75% of sales. At a sales level of $400,000, the company's degree of operating leverage is 8. At this sales level, fixed expenses equal which of the following? A) $87,500. • $100,000. • Dogbert C) $12,500. D) $75,000.
Clicker Question #1: Answer Green Company's variable expenses are 75% of sales. At a sales level of $400,000, the company's degree of operating leverage is 8. At this sales level, fixed expenses equal which of the following? Answer:
Clicker Question #2 • If two companies produce the same product and have the same total sales and same total expenses, operating leverage will be lower in the company with a higher proportion of fixed expenses in its cost structure. • True • False
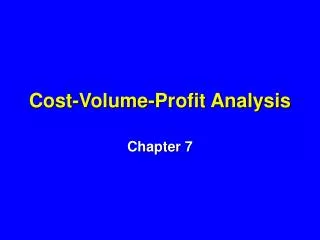
Leverage Graph: Cost Structure Total Sales Revenue Which has a greater degree of operating leverage at point X: A or B? $ A - Total Expenses X B - Total Expenses High FC Indifference Point (indifferent wrt profit between high FC vs. low FC) Low FC Activity
Indifference Point (P7-31) 1) Find equations for both cost lines 2) Set the two equations equal to each other and solve for X
Cost 1 Equation … VC per Unit: = $9 + ($14*1.2) + ($14*1.2*0.75) + $4 = $42.40 per unit Fixed Costs: = ($1,108,000 +$1,685,000) = $2,793,000 Cost 1 Equation Y = $2,793,000 + $42.40X
Cost 2 Equation … VC per Unit: = $7.50 + ($18*0.75) + ($18*0.75*0.60) + $4 = $33.10 per unit (Lower VC per unit) Fixed Costs: = ($1,494,000 +$1,685,000) = $3,179,000 (Higher Total FC) Cost 2 Equation Y = $3,179,000 + $33.10X
Cost 1 = Cost 2 • Set Cost 1 equation equal to Cost 2 equation to determine the point of indifference: • Cost 1 = Cost 2 • $2,793,000 + $42.40X = $3,179,000 + $33.10X • $9.30X = $386,000 • X = 41,505 (rounded) units • The point of indifference in cost structure occurs when 41,505 units are produced and sold.
It is Clicker Time!! Feel Free to Work Together on Clicker Questions
Clicker Question #3 Company Y is considering two production technologies for producing its new product. The cost structures of the two technologies are as follows: • Q: At what sales volume in units (rounded to the nearest whole unit) would Company Y be indifferent in technologies?
Clicker Question #3 Q: At what sales volume in units (rounded to the nearest whole unit) would Company Y be indifferent in technologies? A) 10,000 units. B) 12,100 units. • 13,000 units. • Infinite number of units E) Cannot be determined without additionalinformation.
Sales Mix • Overall sales volume is very important to an organization • The mix of sales also matters • Low CM products? High CM products? • Relative proportions of product sales • Expressed as a % of Total Sales • Sum across products • Revenue • Variable Cost • Fixed cost comes last
Budgeted Sales Mix (P7-20) • Q: What is Break-Even Sales Point given actual sales mix?
It is Clicker Time!! Feel Free to Work Together on Clicker Questions
Clicker Question #4 • Q: Actual sales mix:Sinks: $160,000; Mirrors: $200,000; Vanities: $140,000. What is breakeven sales?
Clicker Question #4 • Q: Actual sales mix:Sinks: $160,000; Mirrors: $200,000; Vanities: $140,000. What is breakeven sales? • That is a good question • $520,000 • $550,000 • $580,000 • $610,000
Important points • Leverage: • Beyond the break even point, higher leverage means that you receive higher profit per unit sold. • Higher leverage likely means higher fixed costs, so the break even point is harder (more units) to reach • Indifference means given two cost structures, the profits are equal at some activity level • In the real world, you would use a computer for multi-product analysis because sales mixes will not remain equal
Summary • Today’s lecture … • Cost Structure Choice and Leverage • Indifference analysis • Multi-product Settings • Next lecture … • Prof Kelly returns to lecture (Hooray!!) • Introduction to Variable Costing (Chapter 8)