Mode Split Strategies
This document discusses mode split strategies and elasticity analysis in transit planning. By estimating ridership on a new route using data from similar routes, it explores how changes in fares or service characteristics impact transit usage. Techniques such as direct estimation of transit share, cross-classification, and regression analysis are highlighted. The text provides insights into disaggregate mode split analysis using utility functions and probabilistic models to assess individual trip characteristics. Examples illustrate the application of elasticity concepts and utility equation results for different income levels.

Mode Split Strategies
E N D
Presentation Transcript
Mode Split Strategies Analogy - if issue is to estimate activity on a single new route; compare with other similar routes Elasticity Analysis - used to examine the impact of a fare or service measure. Elasticity represents the proportionate change in ridership with a proportionate change in service characteristic (cost, travel time,…)
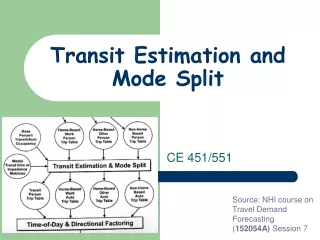
Mode Split Strategies – cont’d Direct Estimation of Transit Share Where system usage is stable, future transit usage may be based on extrapolation of basic TAZ data and trip interchange. Cross-classification or regression tools may be applied Disaggregate Mode Split Examine discrete data (individual) and model the characteristics of the trip maker, the trip type, and the mode
Elasticity analysis example Simplest form is called a shrinkage ratio e = (ridership change/ original ridership) (fare change / original fare) Consider: initial fare = $0.75 with 6,000 riders New fare = $1.00 with 5,500 riders e= (-500/6000) / (+$0.25/ $0.75) = - 0.25
Elasticity analysis example questions: a) What does the – 0.25 factor mean? (typical ranges for cities reported to go from -0.15 to -0.4) b) What limitations do you see?
Direct Estimation of Transit Share May use cross-classification or regression techniques to determine the TAZ to TAZ transit share. Apply user characteristics trip purpose, or trip length info., and system characteristics (walking time, driving time cost, etc. Question: At what stage in 4 step process is modal split conducted?
Disaggregate mode split using Utility Functions and Probabilistic Models Input: Individual responses on mode desirabilty and usage to develop “Utility functions” Preference and usage data may be from census or special home surveys. System data such as travel time and cost generally from network data
Utility Function using time, cost and income • Utility Functions • Example • U=-T-5C/Y • Where: • U = utility • T = travel time in hours • C = cost in dollars • Y = income in thousands of dollars
Utility Function using time, cost and income UTILITY RESULTS • Alternative Characteristics • Time Cost • SOV .5 2.0 • HOV .75 1.0 • Bus 1.0 .75 • Utility Equation Results for two income levels • Y = $40,000 Y = $10,000 • SOV -0.75 -1.5 • HOV -0.88 -1.25 • Bus -1.09 -1.38 • * The bold utility figure would be the predicted alternative for an individual, however, as in Equilibrium Assignments, we recognize there is a probability of other choices. • * • *
Probabalistic models • Several statistical packages are availabe to analyze a utility function and the transit share Multi-nomial logit (available in TransCad) • General: • Pi = eUi / (eUi +eUj + … eUn) • Where the U’s are the utility associated with each mode.
Example problem – analysis for $40,000 • SOV value = e-.75 = 0.47 • HOV value = e-0.88 = 0. 34 • BUS value = e-1.09 = 0.27 • P(sov) = 0.47/( 0.47 + 0.34 + 0.27) = 0.39 • P(hov) = 0.34 • P(bus) = 0.27 • Sum = 1.00