Download
1 / 40
420 likes | 598 Views
MAAT, Permafrost Characterization and Climate Warming. Jim Cassie, P.Eng. BGC Engineering Inc. PRESENTATION OUTLINE. Validation of proposed mean annual air temperature (MAAT) value for the site Overview of permafrost assessment work Relationship of ground temperatures to air temperatures

E N D
MAAT, Permafrost Characterization and Climate Warming Jim Cassie, P.Eng. BGC Engineering Inc.
PRESENTATION OUTLINE • Validation of proposed mean annual air temperature (MAAT) value for the site • Overview of permafrost assessment work • Relationship of ground temperatures to air temperatures • Introduction to climate change and global warming • Global warming model estimates • Conclusions
1. MAAT VALUE FOR SITE Few definitions to review Nearby long term climate stations Review MAAT values from those stations Add mine site weather stations (slightly shorter term) Rationalize MAAT versus latitude
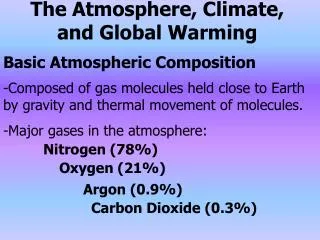
CLIMATE - DEFINITION • Climate, in a narrow sense, is usually defined as the “average weather”. • “Climate is what you expect, weather is what you get.” • More rigorously, as the statistical description in terms of the mean and variability of relevant quantities, over an appropriate period of time. • The classical time period is 30 years, as defined by the World Meteorological Organization (WMO). • Long period to account for climate cycles.
MAAT - DEFINITION Mean annual air temperature value is for either one specific year (e.g. 2007) or for period of record (e.g. 1971 to 2000). One single temperature parameter used to define the climate of an area. Used to define the mean and the ranges of the expected temperature. Used in climate, geography and permafrost work as opposed to annual ground temperatures.
REASONABLE - DEFINITION 1. Capable of reasoning; rational: a reasonable person. 2. Governed by or being in accordance with reason or sound thinking: a reasonable solution to the problem. 3. Being within the bounds of common sense: arrive home at a reasonable hour. 4. Not excessive or extreme; fair: reasonable prices.
MAAT vs. LATITUDE RWDI -11.8oC
MAAT CONCLUSION • Based on interpolation/extrapolation of nearby long-term climate station, a MAAT value of -11.8oC for the High Lake site appears reasonable. • Any warmer value is not scientifically defensible and does not appear reasonable from data trends.
PRESENTATION OUTLINE Validation of proposed mean annual air temperature (MAAT) value for the site Overview of permafrost assessment work Relationship of ground temperatures to air temperatures Introduction to climate change and global warming Global warming estimates Conclusions
2. PERMAFROST WORK Two definitions to start Thermistor locations Results – both deep and shallow
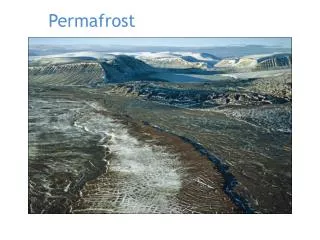
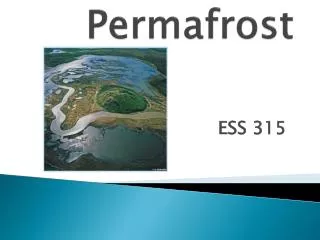
DEFINITIONS Permafrost is ground that remains below 0oC for at least two years. Definition is purely thermal – no commentary on “frozen” nature or on ground ice content. Permafrost types – sporadic, discontinuous and continuous.
DEFINITIONS Talik – unfrozen zone within continuous permafrost. Usually caused by water bodies (heat source). Closed, open and through types.
THERMISTORS AT SITE 2 DEEP CABLES 16 SHALLOW CABLES
THERMAL REGIME Permafrost zone defined by its thermal regime – trumpet curve
RESULTS • Permafrost is 440 m deep (measured at the West Zone). • In the associated talik modeling, mean annual ground temperature of -7oC matched permafrost depth and measured geothermal gradient at depth. • Estimated mean annual ground temperatures of -6oC found for the site. • Ground temperatures (10 to 25 m depth) of -4o to -5oC under three dams. Also found -3.5o to -4oC under two dams directly beside water.
PRESENTATION OUTLINE Validation of proposed mean annual air temperature (MAAT) value for the site Overview of permafrost assessment work Relationship of ground temperatures to air temperatures Introduction to climate change and global warming Global warming estimates Conclusions
3. GROUND TO AIR TEMPS Offset from air to ground temperatures Impact of nearby water bodies Validation of site ground temperatures
AIR TO GROUND GROUND IS 3o TO 6oC WARMER THAN THE AIR (AVERAGE +/- 4.5oC)
IMPACT OF WATER BODIES LARGE LAKE HAS PROFOUND THERMAL IMPACT ON NEARBY TEMPERATURES
RESULTS • MAAT of -11.8oC. • Warming in the ground (3o to 6oC with 4.5oC average) = -8.8o to -5.8oC (-7.3oC) which correlates to -6oC found in the area • Within 20 to 30 m of major water body, 2o to 3oC warming can be felt • Ground temperatures of -4o to -5oC under three dams. Also found -3.5o to -4oC under two dams directly beside water. • Measured ground temperatures are reasonable with MAAT of -11.8oC.
PRESENTATION OUTLINE Validation of proposed mean annual air temperature (MAAT) value for the site Overview of permafrost assessment work Relationship of ground temperatures to air temperatures Introduction to climate change and global warming Global warming estimates Conclusions
4. CLIMATE CHANGE Few definitions Observations Causes
CLIMATE CHANGE - DEFINITION Changes in the variability or average state of the atmosphere over appropriate time scales relative to a given reference period. These changes can be caused by processes internal to the Earth, external forces (e.g. variations in sunlight intensity) and, more recently, human activities.
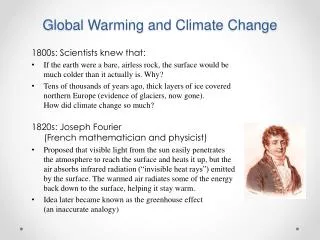
CLIMATE CHANGE - OBSERVATIONS Early decline of the spring snow cover Arctic melt seasons are longer Rivers and lakes are melting earlier Permafrost is warming or disappearing Arctic lakes are disappearing Shorter winter road seasons Less sea ice Thunder and lightning in the north
CLIMATE CHANGE - CAUSES These changes can be caused by processes internal to the Earth, external forces (e.g. variations in sunlight intensity) and, more recently, human activities. Natural Solar variability, volcanic dust levels, ocean variability, geological change Human related (anthropogenic) Greenhouse gases, aerosols, ozone depletion Climate Change Why?
PRESENTATION OUTLINE Validation of proposed mean annual air temperature (MAAT) value for the site Overview of permafrost assessment work Relationship of ground temperatures to air temperatures Introduction to climate change and global warming Global warming model estimates Conclusions
5. GLOBAL WARMING MODELS • To simulate the effects of human warming, scientists formulate very large and very complex mathematical models in computers. • General Circulation Models (GCMs) are a class of computer-driven models for understanding climate and projecting climate change. • Models require input assumptions regarding greenhouse gases (scenarios) in terms on amount and trend.
MODEL LIMITATIONS • Mathematical model simulating the interaction of the earth, atmosphere, oceans and ice cover (WOW!). • Models have numerous noted errors. • Generally, the mean of the results has relatively good agreement for temperature but not so good agreement for precipitation. • Models also have large nodes and hence are NOT site specific. • RGM’s
GOVERNMENT / RESEARCHERS • GCM’s extracted from the Canadian Institute for Climate Studies (CICS) at U of Vic (average of 4 different scenarios and 7 different models) = 7.6oC/100 years • Canadian RCM for eastern Arctic = 5.1o to 6.1oC/100 years • Environment Canada (2007) = 3.8o and 6.8°C of warming until the period 2070 to 2099.
COPPERMINE / KUGLUKTUK 63 YEARS 2.5oC/ 100 YEARS
CONTWOYTO / LUPIN 48 YEARS 5.6oC/ 100 YEARS
ALL DATA POST 1960 46 YEARS ~6oC/ 100 YEARS
SUMMARY OF ESTIMATES INAC Proposal Government / Researcher GCM Estimates BGC Proposed Allowances Factual Warming Trends
PRESENTATION OUTLINE Validation of proposed mean annual air temperature (MAAT) value for the site Overview of permafrost assessment work Relationship of ground temperatures to air temperatures Introduction to climate change and global warming Global warming estimates Conclusions
6. CONCLUSIONS • High Lake MAAT Value = -11.8oC is reasonable. • Air temperatures correlate with deep permafrost and shallow ground temperatures, allowing for heating due to large water bodies. • Warming estimates of 5o to 6.5oC / 100 years are reasonable in light of government/researcher estimates and actual warming over climate period in the north. • These estimates still have an additional Factor of Safety when applied to dam design. Thank You