Download

1 / 62
620 likes | 797 Views
Types of units and variables. Examples of variables. What are the possible units?. Murder rate Litigation rate Support for freedom of speech Income Party identification Liberalism. What is not a variable?. Speed of light Parameters Statistics These are called constants.

E N D
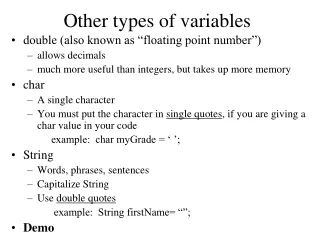
Examples of variables.What are the possible units? • Murder rate • Litigation rate • Support for freedom of speech • Income • Party identification • Liberalism
What is not a variable? • Speed of light • Parameters • Statistics These are called constants.
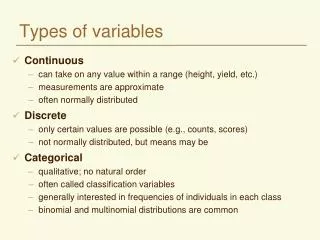
How do we describe variables? • Measures of central tendency (mean, median, mode) • Dispersion around the mean
The Arithmetic Mean (or Average) • The sum of all of the numbers in a set, divided by the number in the set • Most appropriate for symmetric distributions • Influenced by extreme values
The Median • The middle number in the data set. • If you sort the data in order from lowest to highest • The Median is the middle value if there are an odd number of cases. • The Median is the average of the two middle values if there are an even number of cases. • Best measure for skewed distributions
The Mode • The most frequently occurring value. • Used primarily for nominal data. • The peak value of a frequency distribution is also referred to as the mode.
Types of Variables • Nominal • Dichotomous • Dummy • Ordinal • Ratio • Interval • Continuous • Independent • Dependent Note that this list of variables is neither exhaustive nor mutually exclusive.
Dependent variable • This is the political or social phenomenon we are interested in explaining. • It should be important. • And its explanation should matter to us. • There is only ONE dependent variable in any research project. • Dependent variables are also called endogenous variables.
Independent variables • These are the political or social phenomena we use to explain our dependent variable. • Logic can be used to defend why you believe that the independent variable causes the dependent variable. • There should be non-obvious, interesting and important implications from your conclusion. • Independent variables are called exogenous. Sometimes, this categorization is incorrect. (more on that later).
Causal model X Y Independent variable causes dependent variable For example: Percentage of people living in urban areas causes female literacy What could be the units of analysis in this example?
Political Knowledge Interest in Politics .60 (.38) -.22 (.10) Belief that Perception of Perception of Conflict is Legality Bargaining Necessary .69 (.14) 3.22 (.42) Male -.45 (.30) Perception that the .64 (.16) .27 (.10) Process is Fair Perception of Neutrality 1.00 (.49) 1.30 (.47) Dogmatism .58 .74 (.25) (.21) -.44 (.13) Approval of Diffuse Current Justices Support Perception of Future Certainty -.58 (.29) .42 .48 -.34 (.26) (.14) .43 Specific (.11) Biblical (.11) Support Fundamentalism Conservatism Belief that Conflict is Necessary Predicting Perceptions of Fairness of a Supreme Court Decision Support for Bush v. Gore Perception that the Process Should be Legalistic
Data Country pop density Urban% Religion Austria 8000 94.0 58 Catholic Belgium 10100 329.0 96 Catholic Bosnia 4600 87.0 36 Muslim Bulgaria 8900 79.0 68 Orthodox Canada 29100 2.8 77 Catholic Croatia 4900 85.0 51 Catholic Czech Rep. 10400 132.0 . Catholic Denmark 5200 120.0 85 Protstnt Finland 5100 39.0 60 Protstnt France 58000 105.0 73 Catholic Germany 81200 227.0 85 Protstnt Iceland 263 2.5 91 Protstnt
100 80 60 40 20 0 0 20 40 60 80 100 Female literacy and urban density Female Literacy (%) People living in cities (%)
Frequency distribution of a nominal variable: example from the survey of Beslan victims . tab q11 The most important problem that caused | the tragedy in Beslan | Freq. Percent Cum. ----------------------------------------+----------------------------------- Corruption among border guards | 152 13.84 13.84 Corruption among state officials | 561 51.09 64.94 War in Chechnya | 100 9.11 74.04 Lack of consistency in actions of diffe | 51 4.64 78.69 Refusal of federal authorities to negot | 53 4.83 83.52 Inhuman actions of hostage takers | 79 7.19 90.71 Mistakes of FSB and police forces | 53 4.83 95.54 Refused | 14 1.28 96.81 Unsure | 35 3.19 100.00 ----------------------------------------+----------------------------------- Total | 1,098 100.00
Mean, median, mode • Is the mean of the table interesting? • What about the median? • What about the mode?
When you have nominal variables, create a dummy variable generate mimpcorr = 0 if q11 < 97 replace mimpcorr = 1 if (q11 == 1 | q11 == 2) . tab mimpcorr mimpcorr | Freq. Percent Cum. ------------+----------------------------------- 0 | 336 32.03 32.03 1 | 713 67.97 100.00 ------------+----------------------------------- Total | 1,049 100.00 Why is the n 1,049?
Dichotomous Variables • Variables that only have two values. • Gender - male, female • Race - black, white • Agreement - yes, no • true, false • Value - high, low • war, no war • vote, no vote
Frequency: Are you a man or a woman? . tab d1 Gender | Freq. Percent Cum. ------------+----------------------------------- Male | 372 33.88 33.88 Female | 726 66.12 100.00 ------------+----------------------------------- Total | 1,098 100.00 Note the n = 1,098
Mean, median, mode • Is the mean of the table interesting? • What about the median? • What about the mode?
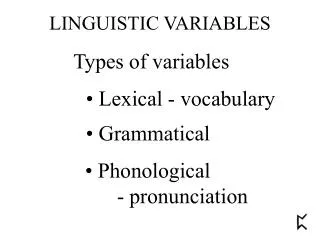
Ordinal Measurement • With ordinal variables, there is a rough quantitative sense to their measurement, but the differences between scores are not necessarily equal. • The values are in order, but not fixed
Examples of Ordinal Measures • Rankings (1st, 2nd, 3rd, etc) • Grades (A, B, C, D, F) • Education (High School, College, Advanced degree) • Evaluations • Hi, Medium, Low • Likert Scales • 5 pt (strongly agree, agree, neither agree nor disagree, disagree, strongly disagree) • 7 point liberalism scale (strongly liberal, liberal, weakly liberal, moderate, weakly conservative, conservative, strongly conservative)
Naming concepts • You should name concepts so that the reader knows what is high and low
Acceptable concept names? • Racism • Perceived inequality • Support for equality • Culture • Institutions • Germany
Concept name? • Given what happened in Beslan, some people think that violence against Ingush is justifiable. Other people think that, despite the tragedy in Beslan, there is no justification for violence against Ingush. Which view is closer to your own? Do you feel this way strongly or only somewhat? • yes (strongly) • yes (somewhat) • no (somewhat) • no (strongly)
Concept name? • How proud are you to be a Russian citizen? very proud, rather proud, not very proud, not at all proud • For the following statement, do you strongly agree, somewhat agree, somewhat disagree, or strongly disagree: I would rather be a citizen of Russia than of any other country in the world.
Concept name? • If you had some complaint about a national government activity and took that complaint to a member of the national government, do you think that he or she would pay a lot of attention, some attention, very little attention, no attention at all?
Frequency distribution: ordinal variable Whether violence against Ingush is | justifiable or not | Freq. Percent Cum. ----------------------------------------+----------------------------------- Violence against Ingush is justifiable | 191 17.40 17.40 Violence against Ingush is justifiable | 126 11.48 28.87 There is no justification for violence | 319 29.05 57.92 There is no justification for violence | 155 14.12 72.04 Refused | 99 9.02 81.06 Unsure | 208 18.94 100.00 ----------------------------------------+----------------------------------- Total | 1,098 100.00
Mean, median, mode • Is the mean of the table interesting? • What about the median? • What about the mode?
Ratio Measurement • Ratio variables have fixed zero points. • A percentage is a ratio variable. • Ratio variables are usually continuous but must not be measured continuously but may be measured discretely
Interval Measurement • Variables or measurements where the difference between values is measured by a fixed scale. Can be continuous or discrete. • Money • Number of people (population) • Age
What about income? • Income increases a dollar at a time • Distance between points seems fixed graduate student salary low professor salary medium high highest
Variables can be categorized based on their relationship with another variable • If the impact of a variable on another variable is interval, then we say that its relationship is interval level • This means that the effect is the same, regardless of the value of the independent variable
Interval relationship 40,000 35,000 30,000 25,000 Luxury spending 20,000 15,000 10,000 5,000 0 0 10,000 20,000 40,000 60,000 80,000 100,000 120,000 Income
40,000 35,000 30,000 25,000 Luxury spending 20,000 15,000 10,000 5,000 0 0 10,000 20,000 40,000 60,000 80,000 100,000 120,000 Income Income and luxury spending
Units of analysis, populations, samples • Units of analysis are usually people, time or places, such as countries, cities or states (provinces); the number of units is called the number of observations or ‘n’ for short • Population – the whole population of the states in the U.S., the population of people in the U.S., all the countries in the world • A sample from above kinds of populations
Statistics versus parameters • Parameters indicate attributes of populations • Statistics indicate attributes of samples • When we have a sample, we use statistics to make inferences about population and therefore the parameters • Usually we do not know parameters • The study of the statistics is the study of making inferences from sample statistics to population parameters • Greek symbols are usually used for parameters and alphabetic symbols are used for statistics
Expected Values and Probabilities • If you have a set of numbers called x: 1,1,2,2,3,3 what is the expected value? • What is P(2)? What is P(1)? What is P(3)? • If our x is: 1,1,3,3,17, then the expected value is 5, even though P(5) = 0. • Suppose we know that E(X) = 5 with the equation y = 5 + 7x. • What is E(Y)?
Variance or Dispersion • Variance is the spread about the mean • Why do we care about variance? • Variance in rights protections • Variance in election outcomes • Variance in the presence of genocide across countries • Variance in income inequality • Variance in economic growth • Variance in revolution
Measures of Dispersion • The Range • Range = Highest value - lowest value • The range of the temperature in a day around the middle of September is 40F to 85F; the range is 45 degrees • Uses only two pieces of information
The Deviation about the Mean • The Deviation about the Mean • Indicates how far a value is from the center.
Two sets of numbers and notation one number in the set place in the set mean of the set X1 = 31 X2 = 7… X = 17 X1 = 24 X2 = 27… X = 23.5
The average of the deviations • So does it make sense to calculate all of the deviations and find their average? • This would seem to give us a measure of the typical amount any given data point might vary.
The Average Deviation • Does the average of the deviations make sense?
Fixing these deviant measures • To represent variation about the mean, we have to calculate deviations as positive numbers • We must get rid of the minus signs in a mathematically acceptable manner.
( ) n å 2 - X X i s 2 = = 1 i n Variance • Square the deviations to remove minus signs, then sum them • Read above as the sum of squared deviations from the mean • The units of variance are squares • Note that the sigma indicates population