Download
1 / 29
290 likes | 366 Views
Explore the FLNN and COVER models in visual search, study T-D and D-D similarities, and effects of spatial organization. Evaluate human performance predictions and examine different visual search models.

E N D
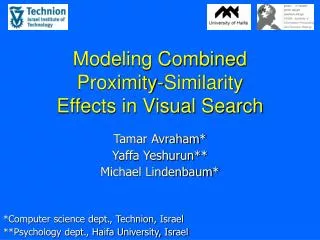
Modeling Combined Proximity-Similarity Effects in Visual Search Tamar Avraham* Yaffa Yeshurun** Michael Lindenbaum* *Computer science dept., Technion, Israel **Psychology dept., Haifa University, Israel
Outline • The FLNN and COVER models for computer vision Avraham & Lindenbaum, IEEE-PAMI 2006 • Study 1: Adapting the models for human performance Avraham, Yeshurun & Lindenbaum , Journal of Vision 2008 • Study 2: Extending the models to account for spatial organization effects.
The FLNN model Farthest Labeled Nearest Neighbor feature extraction feature space T D D orientation 0° 60° 30° T = 0° D = 30°, 60° Avraham & Lindenbaum, IEEE-PAMI 2006
2 1 3 4 The FLNN model – cont. Alternative parallel explanation: dynamic priority map Avraham & Lindenbaum, IEEE-PAMI 2006
1 2 D T D 2 D 1 D T 3 Qualitative model behavior – pop-out behavior • Homogeneous distractors • Clustered distractors – maximum one from each cluster Avraham & Lindenbaum, IEEE-PAMI 2006
D T Visual Search Difficulty • Search difficulty depends on two factors: • T-D similarities • D-D similarities • Quantitative measures of search difficulty • the saliencymeasure (Rosenholtz 99) • our COVER measure Duncan & Humphreys 89 similarity theory T easy difficult Avraham & Lindenbaum, IEEE-PAMI 2006
The COVER measure • A minimum-d-cover (Kolmogorov 61): the minimum number of spheres with diameter d covering all points d Avraham & Lindenbaum, IEEE-PAMI 2006
D D D T D T dT dT The COVER measure • If d = dT(the minimum T-D distance), • minimum-d-cover (COVER) the search difficulty D D D dT T COVER = 1 COVER = 3 COVER = 2 T-D similarity effects D-D grouping Avraham & Lindenbaum, IEEE-PAMI 2006
COVER and FLNN COVER = an inherent limitation for all models/algorithms FLNN Performance ≥ COVER Avraham & Lindenbaum, IEEE-PAMI 2006
Study 1:Testing the ability of COVER and FLNN to predict human performance Avraham, Yeshurun & Lindenbaum, Journal of Vision 2008
T dT T dT • COVER with internal noise: Low noise Higher noise • Other visual search models • Temporal-serial (Bergen&Juletz 83’) • Signal-Detection-Theory (Palmer et. al. 93’, Eckstein 00’) • Target-Saliency model (Rosenholtz99’) • Best-Normal (Rosenholtz01’) • RCref(Rosenholtz01’) Avraham, Yeshurun & Lindenbaum, Journal of Vision 2008
Study 1 Manipulated T-D and D-D similarity Accuracy. 2IFC. Avraham, Yeshurun & Lindenbaum, Journal of Vision 2008
COVER: Prediction Comparison correlation between accuracy and measure Good correlation between accuracy and COVER Avraham, Yeshurun & Lindenbaum, Journal of Vision 2008
FLNN - Prediction Comparison FLNN best in 2 test. Lowest 2/df values Avraham, Yeshurun & Lindenbaum, Journal of Vision 2008 Avraham, Yeshurun, Lindenbaum VSS 2011
Study 1 Summary • FLNN and COVER predict T-D and D-D similarity effects better than other prominent computational models. • The models quantify grouping-by-similarity involved in visual search, by suggesting that the degree of within-group heterogeneity depends on the T-D similarity. Avraham, Yeshurun, Lindenbaum VSS 2011
Study 2: Spatial Organization Effects test and model how the effects of grouping by proximity and grouping by similarity are combined in the context of visual search
Manipulating Spatial Organization condition 1 condition 2 condition 3 no clusters 6 clusters 3 clusters Does spatial organization matter? Experiment 1T=0° D = 23°, 47°, 70° The same 30 elements in all conditions Avraham, Yeshurun, Lindenbaum VSS 2011
Experiment 1: Results • Previous models do not account for this significance Avraham, Yeshurun, Lindenbaum VSS 2011
Spatial Organization Effects - Modeling no clusters 3 clusters COVER=2 COVER=3 COVER=3 • One possibility: a multi scale approach (e.g., Itti et al. 1998, Rosenholtz et al. 2007) How to combine the measure over scales? max? weight and sum? Avraham, Yeshurun, Lindenbaum VSS 2011
Spatial Organization Effects – Modeling Indicates the relative effect of the forces • Our models need only some measure of distance between each two elements • Combine feature difference and spatial distance Avraham, Yeshurun, Lindenbaum VSS 2011
Spatial Organization Effects – Modeling • Advantages: • same treatment for similarity and proximity • understand and quantify the relative effect of each • Questions to answer in this study: • Will this enable our models to account for the spatial organization effect? • What is the value of ? • Is stable or stimuli dependent? Avraham, Yeshurun, Lindenbaum VSS 2011
FLNN predictions prediction with predictive ability vs. Maximum value of 2 to pass the 2 test • Conclusions: • Combination of feature distance and spatial distance is essential for prediction • Limited possibilities: implies that the model is informative • Relates to previous findings regarding the combined effects of proximity and similarity on perceptual grouping (e.g., Kobovy & van den Berg 2008) Avraham, Yeshurun, Lindenbaum VSS 2011
Preliminary: Is stable or stimuli dependent? • Experiment 2: Manipulate the number of distractor types • Experiment 3: Manipulate the distractors variance Avraham, Yeshurun, Lindenbaum VSS 2011
Exp 2 (preliminary): manipulating the number of distractor types no clusters 4 clusters 2 distractor types (15°, 30°) 4 distractor types (15°, 30°, 45°, 60°) Avraham, Yeshurun, Lindenbaum VSS 2011
Exp 3 (preliminary): manipulating distractors variance D = 15°, 60° D = 15°, 45° D = 15°, 30° clustered not clustered Avraham, Yeshurun, Lindenbaum VSS 2011
Experiment 2 and 3: (preliminary) Results Experiment 2 Results Experiment 3 Results Avraham, Yeshurun, Lindenbaum VSS 2011
Experiment 2 and 3: FLNN Predictions with Experiment 2 Predictions Experiment 3 Predictions Avraham, Yeshurun, Lindenbaum VSS 2011
Summary • A study of the effects of spatial organization on visual search • The FLNN model can predict effects of grouping by similarity and grouping be proximity • As it uses an explicit combination of feature difference and spatial distance, it can help us understand the relative effect of similarity and proximity on visual search Avraham, Yeshurun, Lindenbaum VSS 2011
Thank you Tamar Avraham Michael Lindenbaum Yaffa Yeshurun