Download
1 / 51
510 likes | 667 Views
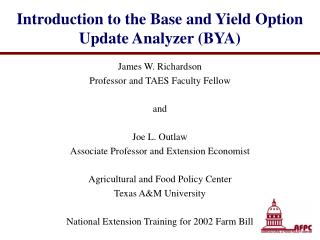
A Discussion on the 2002 Farm Bill: The Facts We Really Need to Know. Joe L. Outlaw Associate Professor and Extension Economist – Management and Policy. Farm Marketing Workshop and 2002 Farm Bill Review First Victoria National Bank Victoria, TX November 13, 2002. 2002 Farm Bill.

E N D
A Discussion on the 2002 Farm Bill: The Facts We Really Need to Know Joe L. Outlaw Associate Professor and Extension Economist – Management and Policy Farm Marketing Workshop and 2002 Farm Bill Review First Victoria National Bank Victoria, TX November 13, 2002
2002 Farm Bill Outline of Presentation • Where We Are and Next Steps • General Overview • Direct Payments, CCPs, and MLGs • Payment Limitations • Conservation Program Changes • 2002 Elections • Issues and Insights
Where We Are • Commodity program sign up for crop years 2002 and 2003 announced for October 1st – June 2, 2003 • Most important part is base and yield update decision • For most it boils down to 2 questions: • Have I been under planting bases? • Do the drought impacts outweigh genetic improvement? • AGECOEXT.TAMU.EDU • Click on 2002 Farm Bill Educational Materials • In Texas, has been used over 28,000 times on 11.8 million acres • Second most important part is developing long term written leases
2002 Farm Bill General Overview • 6 year farm bill beginning in 2002 and ending in 2007 • Comprehensive bill covering: • Will be required to sign-up every year • Different from 1996 farm bill • Implications for budget reconciliation legislation
General Overview (Cont.) • Commodity provisions similar to previous programs • Continue direct “AMTA” payments • Continue marketing loan gains/LDPs • No production controls • Initiate counter-cyclical payments (CCPs) • Similar to target price/deficiency payment program • Allows update of bases and program yields • Major changes for Soybeans and Peanuts • Provisions similar to other program crops
Share of Mandatory Program Spending by Farm Bill Title Budget Authority, FY 2002-2011. $782 Billion Total Does not include funding for discretionary programs which is provided through annual appropriations. Based on CBO’s March 2002 Baseline.
Allocation of U.S. Budget Outlays by Function, FY 2001 Human Resources includes: health, medicare, social security, etc. Physical Resources includes: transportation, community and regional development, etc. Source: Budget of the U.S. Government www.whitehouse.gov/omb/budget/fy2003/pdf/hist.pdf
Selected Direct Payments 25 20 15 Billion Dollars 10 5 0 1997 1999 2001 2003 2005 2007 2009 2011 Crop Year Fixed Payments Marketing Loans CCPs Supplementals Source: FAPRI, July 2002 Baseline
U.S. Crop Prices 1.4 1.2 3.25 2.23 1.0 5.13 2.70 1.88 4.40 0.46 0.8 0.40 Index, 1995-99=1 5.02 4.91 0.6 0.4 0.2 0.0 Corn Soybeans Wheat Cotton Rice 2000-01 Avg. 2002-07 Avg. Source: FAPRI, September Update of July 2002 Baseline
Conservation Program Expenditures 5.0 4.0 3.0 Billion Dollars 2.0 1.0 0.0 1997 1999 2001 2003 2005 2007 2009 2011 Fiscal Year Conservation Reserve Other Conservation Source: FAPRI, July 2002 Baseline
Crop Base Updating • Current covered crops have five choices: • Retain current AMTA bases • Retain current AMTA bases and add max oilseeds (if applicable) • Retain current AMTA bases and add min oilseeds (if applicable) • Update bases by using 1998-2001 planted and considered planted acreage for all crops • Retain current AMTA bases and add some combination of oilseeds (if applicable) • Base updating will be on a farm (FSA farm number) by farm basis • Fixed and counter-cyclical payments made on 85% of crop base
Farm Program Yield Updating • Only applies to counter-cyclical payment • Only allowed if update base acres using 1998-2001 planted acreage • Producers have three choices: • Retain current program yields • Update yields by adding 70% of the 1998-2001 average yield (excluding any year planted acreage was zero) minus current program yields to the current program yield • Update yields by taking 93.5% of 1998-2001 yields, excluding any year planted acreage was zero • 1998-01 yields will be weighted average over period (weighted by planted acres each year) No Rules Of Thumb
Farm Program Yield Updating (Cont.) • Can replace any of the 1998-2001 yields with 75% of the county average for that year • Using 75% of 1998-01 county average yield per harvested acres to replace any yield • Yield updating will be on a crop by crop basis for each FSA farm # • All crops on a farm are required to use the same method for determining yields
Non-program or Wildcat Acres • Refers to cropland used in the production of a covered commodity over the 1998 to 2001 period that was not receiving PFC payments provided for in the 1996 Farm Bill • This is land that has not been “in the program” from 1996 to 2002 • If a producer chooses to update base acres then this land can be added during signup • Will have to prove acres • Program yields for the purposes of calculating direct payments will be assigned to these acres • Law states that yields for similar farms in the area will be used • The County Committee will assign a yield based on yields for 3 similar farms in the county • Program yield used for calculating the CCP can be “updated” using proven yields over the 1998 to 2001 period and choices discussed earlier
Soybeans and Other Oilseeds • Brings soybeans and other under same provisions as other program crops • Payment yield establishment • Average yield per planted acre over the 1998-2001 period excluding any year planted acreage was zero • Can replace low yields in the 1998-2001 period with 75% of the county yield • Yield ratio is the ratio resulting from dividing the national average yield for the oilseed for the 1981-85 crops by the national average yield for the 1998-01 crops • Payment yield = average yield x yield ratio • Can update yield for counter-cyclical payment purposes • Provides same three option given other crops
Direct Payments • Can choose to update base but will use current AMTA yield • Soybeans and peanuts different • Same formulaDirect Payment = (payment rate x (base acres x .85) x farm program yield) • Timing • 2002 as soon as practical after enactment • 2003-2007 not before October 1 of the calendar year in which the crop of the covered commodity is harvested • Advance Payments • Producer Option • For 2003-2007 up to 50% in any month between December 1 of the year before and October 1 (date payment is otherwise made)
Counter-Cyclical Payments • Commodity specific based off of national price trigger • Base owners and/or producers will receive a payment that depends on the effective price for the commodity: Target price - Effective price Counter-cyclical payment rate ($/unit) CCP = CCP rate x (Base acres x .85) x Updated FPY • Effective price equals the higher of market price or loan rate plus the direct payment rate • The national market price is the 12 month marketing year average for the crop (likely to be weighted average) • Decoupled from production decision
Commodity Marketing Years • Wheat, barley, oats, canola, rapeseed, and flaxseed • June of year crop is harvested through next May • Corn, sorghum, soybeans, sunflower seed, safflower, and mustard seed • September of year crop is harvested through next August • Upland cotton, rice and peanuts • August of year crop is harvested through next July
Counter-Cyclical Payments (Cont.) • Won’t know for sure what total payment will be until end of marketing year • This will be roughly a year after harvest • If Secretary determines CCPs are required: • 2002 – 2006 Payment Timing • Producer can elect to receive up to 35% of the projected counter-cyclical payment in October of the year the crop is harvested • An additional 35% beginning in February of the following year • The balance after the end of the 12 month marketing year for the crop • 2007 Payment Timing • First payment (40%) after 6 months of marketing year • Final payment after the end of the 12 month marketing year for the crop
Loan Rates Wheat loan rates will be announced by class: hard red spring, hard red winter, soft red winter, soft white wheat, and durum.
Loan Rates • USDA has used the increase in most loan rates to adjust county loan rate differentials • The new rates have been announced and there are already calls for their change
Distribution of Government SupportExample: Cotton Reflects payments not on full production(payment acres = .85 x base acres) Revenue per Pound Target Price – $0.724 Decoupled (do not have to produce to receive payment) CCP } Loan Rate – $0.52 Fixed payment – $0.0667 MLG/LDP Coupled (do have to produce to receive benefits from marketing loans gains or LDPs) Market Price Market Receipts
Probability that CC Payments for Cotton are Zero or Max, 2002 – 2007. Source: FAPRI, September Update of July 2002 Baseline
Probability that CC Payments for Corn are Zero or Max, 2002 – 2007. Source: FAPRI, September Update of July 2002 Baseline
Probability that CC Payments for Rice are Zero or Max, 2002 – 2007. Source: FAPRI, September Update of July 2002 Baseline
Probability that CC Payments for Sorghum are Zero or Max, 2002 – 2007. Source: FAPRI, September Update of July 2002 Baseline
Separate Sets of Limits 1Covered commodities are: wheat, corn, grain sorghum, barley, oats, upland cotton, rice, soybeans, and other oilseeds (sunflower seed, rapeseed, canola, safflower, flaxseed, mustard seed, or if designated by the Secretary, another oilseed). 2Loan commodities are: covered commodities plus extra long staple cotton, wool, mohair, honey, dry peas, lentils, and small chickpeas.
Payment Limitations (Cont.) • Adjusted Gross Income Limitation • Defined as: the 3 year average of the adjusted gross income or comparable measure of the individual or entity over the 3 preceding years • Begins in 2003 • $2.5 million limit • Unless not less than 75% of AGI comes from farming, ranching, or forestry operations • An individual or entity shall not be eligible to receive any benefit (direct payments, counter-cyclical payments, and marketing loan gains/LDPs) • Certification: An individual or entity shall provide to the Secretary • Certification from a CPA or another third party • Information and documentation through other procedures established by the Secretary • Creates a new commission to study and make recommendations regarding payment limits
Payment Timeline for Most Commodities Oct 02 Dec 02 Feb 03 Aug 03 Oct 03 Dec 03 1st CCP Advance for ’02 crop 1st CCP Advance for ’03 crop 2nd CCP Advance for ’02 crop CCP Final for ’02 crop Opportunity for Direct Payment 50% Advance for ’03 crop Final Direct Payment for ’03 crop Extra Payment for ’02 crop FSA has started making quota buyout payments
2002 Farm Bill Conservation Program Changes • Conservation Reserve Program • Increase in acreage cap • Environmental Quality Incentives Program • Conservation Security Program • Will it happen now?
Environmental Quality Incentives Program (EQIP) • To promote ag production and environmental quality as compatible goals, and to optimize environmental benefits (2002 – 2007) • Very popular program • Phased in increase in funding at: 2002 2003 2004 2005 2006 2007 Billion $ .4 1.0 1.0 1.2 1.2 1.3 • Funds to be split 60/40 between livestock and crops • Cost-share (75 to 90%) and incentive payments • 1 to 10 year contracts • Payments limited to $450,000 per individual or entity over the duration of the contract(s)
EQIP (Continued) • For 2002 • Texas had 11.5 million original allocation • Received roughly 12 million more from 2002 FB • Had to be obligated before September 30th • Reopened signup until June 28th • New applicants or changes to original applications • Other Changes • After this year, no more priority areas • Eliminated buy downs • Additional 6.6 million directed toward improved irrigation efficiency over Ogallala Aquifer • Had to be obligated before September 30th
Conservation Security Program • Establishes a new national incentive payment program for maintaining and increasing farm and ranch stewardship practices • Begins in 2003 and runs through 2007 • Three Tiers (levels) of involvement I – III • Tiers refer to length of contract and number of significant resource concerns addressed • Annual payment limits • Tier I - $20,000 • Tier II - $35,000 • Tier III - $45,000 • Nothing definite out on rules • Apparently going to target resource concerns by county
Conservation Security Program (Cont.) Depending upon county resource concerns • Conservation Practices • Nutrient management • IPM • Water conservation (including irrigation and water quality mgmt) • Grazing, pasture, rangeland mgmt • Soil conservation, quality, and residue mgmt • Invasive species mgmt • Fish and wildlife habitat conservation, restoration, and mgmt • Air quality mgmt • Energy conservation measures • Biological resource conservation and regeneration • Contour farming • Strip cropping • Cover cropping • Controlled rotational grazing • Resource-conserving crop rotation • Conversion of portions of cropland from a soil depleting use to a soil-conserving use, including production of cover crops
2002 Elections • What We Knew on Nov 5th • Presidential Party traditionally loses ground • Bush’s approval rating extremely high • Mid-term elections typically have low voter turnout • Political battleground has been suburbia – this time it is rural America • House is Republican, Senate Democratic • Senate Democratic due to switch of VT Senator Jeffords from GOP to Independent • MN Governor appoints Dean Barkley-Independent to serve remainder of Wellstone’s-D term • Could switch Senate immediately with Carnehan, MO loss • Republicans needed to win 21 of 34 seats to take control of Senate
2002 Elections Continued • As of Nov 6th the situation in January will be: • Senate – 100 seats • Republicans (51) • Democrats (47) • Independents (1) and Unsettled (1) • House – 435 seats • Republicans (228) • Democrats (205) • Independents (1) and Unsettled (1) • Republicans Control Both House and Senate (expected changes) • Trent Lott expected to assume leadership of Senate • Thad Cochran, MS would become Chairman of Ag and Appropriations • Current ranking member Lugar would Chair Senate Foreign Relations Committee
Current Senate Ag Committee • Richard Lugar, IN – Ranking • Jesse Helms, NC (Dole) • Thad Cochran, MS • Mitch McConnell, KY • Pat Roberts, KS • Peter Fitzgerald, IL • Craig Thomas, WY • Wayne Allard, CO • Tim Hutchinson, AR (Pryor) • Mike Crapo, ID • Tom Harkin, IA – Chairman • Patrick Leahy, VT • Kent Conrad, ND • Tom Daschle, SD • Max Baucus, MT • Blanche Lincoln, AR • Zell Miller, GA • Debbie Stabenow, MI • E. Benjamin Nelson, NE • Mark Dayton, MN • Paul Wellstone, MN (Coleman)
Current House Ag CommitteeRepublicans Resigning as of May 31, 2003 • Gil Gutknecht, MN • Bob Riley, AL • Michael Simpson, ID • Doug Ose, CA • Robin Hayes, NC • Charles Pickering, MS • Tim Johnson, IL • Tom Osborne, NE • Mike Pence, IN • Dennis Rehberg, MT • Sam Graves, MO • Adam Putnam, FL • Mark Kennedy, MN • George Gekas, PA • Larry Combest, TX – Chairman • John Boehner, OH • Bob Goodlatte, VA • Richard Pombo, CA • Nick Smith, MI • Terry Everett, AL • Frank Lucas, OK • Saxby Chambliss, GA • Jerry Moran, KS • Bob Schaffer, CO • John Thune, SD • William Jenkins, TN • John Cooksey, LA
Current House Ag CommitteeDemocrats • Bob Etheridge, NC • Leonard Boswell, IA • David Phelps, IL • Ken Lucas, KY • Mike Thompson, CA • Baron Hill, IN • Joe Baca, CA • Rick Larsen, WA • Mike Ross, AR • Anibal Acevedo-Vila, Puerto Rico • Ron Kind, WI • Ronnie Shows, MS • 1 vacancy • Charles Stenholm, TX – Ranking • Gary Condit, CA • Collin Peterson, MN • Cal Dooley, CA • Eva Clayton, NC • Earl Hilliard, AL • Tim Holden, PA • Sanford Bishop, Jr, GA • Bennie Thompson, MS • John Elias Baldacci, ME • Marion Berry, AR • Mike McIntyre, NC
2002 Farm Bill Available Extension Resources • Extension Economists • County Extension Agents • Website • agecoext.tamu.edu • Click on 2002 Farm Bill Educational Materials • Master Marketer • FARM Assistance
FARM Assistance Benefits for Producers 1. Where am I at today?Comprehensive financial analysis of both the whole farm operation and individual farm units 2. Where am I likely going if I don’t changeUp to 10 year projection period 3. What are the likely impacts of different alternatives? 4. How do I compare to other producers in the area?Database of Base Farm Analysis
Impact of the Program On Participating Farmers and Ranchers • Aggregate measure • The difference between the projected wealth position of a producer’s base situation versus their suggested alternatives • This measure of benefit to the producer reflects the value of the analysis in terms of avoiding losses or capturing gains in wealth relative to the baseline projection • To date, the program has resulted in benefits to Texas farmers and ranchers of $114 million or nearly $306,000 per producer
Issues on the Horizon • National press having a hard time moving on to something else – spending • Annual signup • Conservation spending has a bulls eye on it • Disaster assistance for 2001 and 2002 crops • Payment limitations brought up in appropriations process • This issue is far from settled
Policy Insights • Disaster Aid • $752 million in Section 32 funds • Agriculture Appropriations ?? • Only 2 of 13 appropriations bills have been passed • Most likely will have continuing resolutions to end of January • $159 Billion budget deficit • Better learn how to market!