Mastering Accuracy and Precision in Measurement
Understand the key concepts of accuracy and precision in measurement, learn to differentiate between them, and explore examples of their application in real-life scenarios. Dive into the significance of significant figures and how to calculate percent error. Master the rules for determining significant figures and performing calculations with them. Enhance your measurement skills with this comprehensive guide.

Mastering Accuracy and Precision in Measurement
E N D
Presentation Transcript
Accuracy & Precision Two important points in measurement
THE BIG CONCEPT • Accuracy –indicates the closeness of the measurements to the true or accepted value. 2. Precision - The closeness of the results to others obtained in exactly the same way.
High Accuracy High Precision High Precision Low Accuracy Accuracy vs. Precision
Can you hit the bull's-eye? Three targets with three arrows each to shoot. Accurate and precise Precise but not accurate Neither accurate nor precise How do they compare? Can you define accuracy vs. precision?
Example: Accuracy Who is more accurate when measuring a book that has a true length of 17.0 cm? Susan: 17.0 cm, 16.0 cm, 18.0 cm, 15.0 cm Amy: 15.5 cm, 15.0 cm, 15.2 cm, 15.3 cm
Example - Precision • Which set is more precise? A. 18.2 , 18.4 , 18.3 B. 17.9 , 18.3 , 18.8 C. 16.8 , 17.2 , 19.4
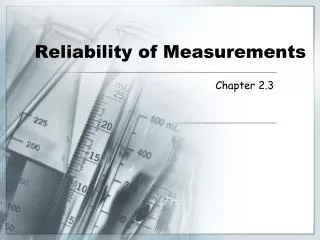
Precision and Instruments • Do all measuring devices have the same amount of precision?
You indicate the precision of the equipment by recording its Uncertainty • Ex: The scale on the left has an uncertainty of (+/- .1g) • Ex: The scale on the right has an uncertainty of (+/- .01g)
What is Percent Error ? • When an experiment is done, it is pretty much certain that the answer is not going to be exactly correct. • Many variables and actions go into an experiment. A change or a misstep in any one of them can result in an answer that is a bit different from the actual value. • Actions such as mismeasurement, lack of purity of reagents, and poor lab technique can all result in error.
How to Calculate Percent Error • We use the following formula. • Y Your observed result (what you got) • A Actual Result (what you should get) • I( Y – A) / A )I x 100 % • You will use this often in Lab.
Example • A Lab group was working in a Lab to determine the percent of Magnesium in a sample of Magnesium Oxide. They determined it to be 58.3g They looked up the actual value and found it to be 60.3g • What is their percent error ?
Solving for Percent Error • Let’s start with the formula • I( Y – A) / A )I x 100 % • Substituting in gives us the following: • I(58.3 – 60.3) / 60.3 )I x 100 % • I( - 2 / 60.3)I .00331 • .00331 x 100 % = 3.31 %
Significant Figures In Measurements
Sig Figs tell you what place to round your answers to. • Your final measurement (answer) can never be more precise than your starting measurement. • To understand that idea, we will discuss accuracy vs. precision
Significant Figures The numbers reported in a measurement are limited by the measuring tool.
How to Determine Significant Figures in a Problem Use the following rules:
Rule #1 • Every nonzero digit is significant in a measurement. Examples: 24m = 2 3.56m = 3 7m = 1
Rule #2 – Sandwiched 0’s • Zeros between non-zeros are significant Examples: 203,205 = 6 7003m = 4 40.9m = 3
Rule #3 – Leading 0’s • Zeros appearing in front of non-zero digits are not significant • Act as placeholders Examples: 0.0000000056 = 2 0. 24m = 2 0.453m = 3
Rule #4 – Trailing 0’s with Decimal Points • Zeros at the end of a number and to the right of a decimal point are significant. Examples: 1.0 = 2 43.00m = 4 1.010m = 4 1.50m = 3
Performing Calculations with Significant Figures • Rule: When adding or subtracting measured numbers, the answer can have no more places after the decimal than the LEAST of the measured numbers. • Only count the Sig Figs that come after the decimal.
Adding and Subtracting • 2.45cm + 1.2cm = 3.65cm, Round off to 3.7cm • 7.432cm + 2cm = 9.432 Round to 9.4cm
Multiplication and Division • Rule: When multiplying or dividing, the result can have no more significant figures than the least reliable measurement. • Count all of the Sig figs in the entire number.
Examples • 56.78 cm x 2.45cm = 139.111 cm2 Round to 139cm2 • 75.8cm x 9.6cm = ?
State the number of significant figures in each of the following: A. 0.030 m 1 2 3 B. 4.050 L 2 3 4 C. 0.0008 g 1 2 4 D. 3.00 m 1 2 3 E. 2,080,000 bees 3 5 7 Learning Check
Learning Check A. Which answer(s) contain 3 significant figures? 1) 0.4760 2) 0.00476 3) 4760 B. All the zeros are significant in 1) 0.00307 2) 25.300 3) 2.050 x 10³ C. 534,675 rounded to 3 significant figures is 1) 535 2) 535,000 3) 5.35 x 10⁵
Learning Check In which set(s) do both numbers contain the samenumber of significant figures? 1) 22.0 m and 22.00 m 2) 400.0 m and 40 m 3) 0.000015 m and 150,000 m