Download
1 / 17
210 likes | 332 Views
Weather Normalization of Compliance GPCD ( SBx 7-7) . Anil Bamezai , PhD Principal, Western Policy Research (310) 314-7691 bzi@mindspring.com. Background.

E N D
Weather Normalization of Compliance GPCD (SBx 7-7) Anil Bamezai, PhD Principal, Western Policy Research (310) 314-7691 bzi@mindspring.com
Background • Retailers may consider the following factors while determining compliance daily per-capita water use (Section 10608.24 (d) of SBx7_7): • (A) Differences in evapotranspiration and rainfall between baseline and compliance years • (B) Substantial changes to commercial and industrial water use • (C) Substantial changes to institutional use Presented to the USC, April 16, 2013
Connection with CUWCC • The Council also permits a GPCD approach for complying with the MOU, including weather normalization • The methodology presented here was adopted by the Council for this purpose • Can this methodology also serve the needs of SBx7-7? Presented to the USC, April 16, 2013
Three Key Study Questions • What can serve as a reliable weather data source? • Using a common data source is preferable • We considered PRISM (a new weather tool from DWR) • How to account for inter-agency variation in weather’s impact upon demand? • We considered peaking factor • How should weather be depicted? • Temperature and rainfall, or • Reference ETo and rainfall Presented to the USC, April 16, 2013
Study Sample • Data drawn from a total of 18 agencies • These are located in different parts of the state • Sample peaking factors range between 1.6-6, comparable to the state • Agency data were collected in two phases • First phase did not lead to representative sample • Agencies supplied monthly production and population data (1995 onwards), we obtained the weather data Presented to the USC, April 16, 2013
Weather Data Sources • PRISM provides complete coverage of California from 1990 to present • Provides temperature, rainfall, reference ETo • For each 4x4 km tile in the state (26,000+ tiles) • Has been validated by DWR against CIMIS and other data sources statewide • This study additionally compares PRISM to NOAA temperature and rainfall data Presented to the USC, April 16, 2013
Q1. How Does PRISM Compare? • DWR has validated PRISM’s weather data predictions statewide and found them good • Our comparisons agree with their conclusions • Data between NOAA and PRISM correlate highly, temperature corr. = 0.96, rainfall corr. = 0.94 • Model results are also insensitive to NOAA vs. PRISM data • PRISM can thus serve as a reliable statewide weather data source Presented to the USC, April 16, 2013
Inter-Agency Variation in Impact of Weather on Demand • Agencies differ in their mix of weather-sensitive and –insensitive end uses • Data about these are difficult to collect • The selected weather normalization method must account for this variation • We examined if peaking factor can be used as an explanatory variable • By first estimating agency-specific weather models Presented to the USC, April 16, 2013
Model Structure Log(Monthly Gross Water Use) = α*Log(Population) + β*Seasonal Indicators + γ*Time Trend + δ*Rainfall Adjusted ETo + θ*Agency Indicators + ε (random error) δ equals the percent impact on demand of 1” change in rainfall adjusted reference ETo Presented to the USC, April 16, 2011
Q2. Does Peaking Factor (PF) Work? • Variation in weather impacts across agencies must be tightly correlated with PF (correlation=0.77) • Weather impact should be zero at a peaking factor equal to 1 (it is) • Yes, PF is a viable modeling strategy Presented to the USC, April 16, 2013
Weather Normalization Factors • Data were combined over all 18 agencies for estimating PF-dependent weather coefficients • These coefficients vary by PF and 3 seasons • The models account for population, seasonality and agency-specific time trends • Estimated models were subject to several sensitivity tests, appear to fit robustly Presented to the USC, April 16, 2013
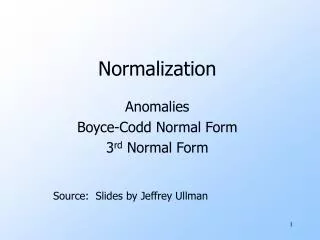
Model Fit for a Low PF Agency Presented to the USC, April 16, 2013
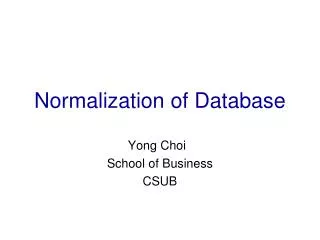
Model Fit for a Medium PF Agency Presented to the USC, April 16, 2013
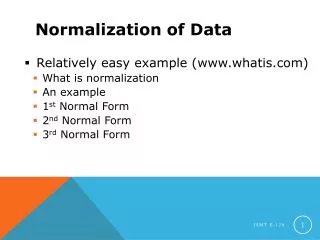
Model Fit for a High PF Agency Presented to the USC, April 16, 2013
Q3. How Should We Depict Weather? • Several sensitivity analyses were performed to address whether we should use: • Temperature and rainfall, or • Reference ETo and rainfall • Weather normalization results are not sensitive to either choice • Neither are they sensitive with respect to weather data source (NOAA vs. PRISM) • However, we recommend using rainfall-adjusted reference ETo from PRISM to depict weather • Individual agency weather impacts scale best with PF when this weather measure is used Presented to the USC, April 16, 2013
Key Conclusions • It is possible to develop a general weather normalization strategy using peaking factors • Does not require detailed agency characteristics • PRISM can serve as a one-stop shop for weather data • Important to use the same weather data source for modeling and for compliance testing • Rainfall-adjusted reference ETo should be the preferred metric for depicting weather Presented to the USC, April 16, 2013
Methodology In Practice BY MONTH: • Calculate average baseline rainfall adjusted ETo • Calculate compliance year rainfall adjusted ETo • Calculate difference between compliance and baseline ETo • Calculate average baseline peaking factor • Transform peaking factor (1-1/Peaking Factor) • Select the seasonal model coefficient from this study • Calculate the weather impact factor • (Change in ETo) x (Transformed Peaking Factor) x ( Model Coefficient) = Weather Impact Factor • Divide compliance year production by the weather impact factor • Convert normalized production into compliance GPCD Presented to the USC, April 16, 2011