Download
1 / 35
350 likes | 482 Views
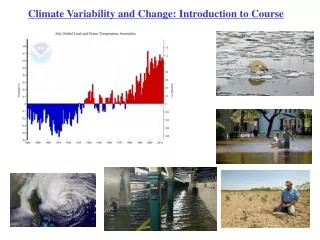
Climate variability in the Southern Ocean Sector: Relevance to the McMurdo LTER. Martin Visbeck Department of Earth and Environmental Sciences Lamont-Doherty Earth Observatory Columbia University, New York input from: Gerd Krahmann, Arnold Gordon and Stan Jacobs. Topics for discussion.

E N D
Climate variability in the Southern Ocean Sector:Relevance to the McMurdo LTER Martin Visbeck Department of Earth and Environmental SciencesLamont-Doherty Earth Observatory Columbia University, New York input from:Gerd Krahmann, Arnold Gordon and Stan Jacobs
Topics for discussion • Large Scale Oceanography of the Southern Ocean • Climate Variability in the Southern Ocean - The Southern Annular Mode and its impacts • Some aspects of the hydrography of the Ross Sea - Formation of high salinity bottom water - Exchanges at the shelf break front - One of a few sources for Antarctic Bottom Water • Historical Data • Observational Plan
Southern Ocean is a meeting/mixing place Schmitz (1996)
Southern Ocean Meridional Circulation Speer et al., 2000
Southern Ocean Bottom Water Ross Sea is one of the sources (Terra Nova Bay) • Catabatic winds form sea ice near ice shelves • Salt “left in the ocean” (brine rejection) • Formation of high salinity shelf water (very dense) • Once over the shelf break Antarctic Bottom Water formed
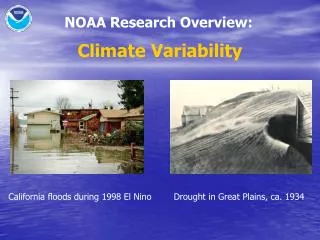
Climate Variability • We have to assume, that much of the shorter term climate variability involves complex interactions between the: • Atmosphere - changes in the wind, cloudiness, and radiation • Ocean - changes in the density and circulation (most likely in response to atmospheric forcings) • Sea Ice - changes in the timing, extent and volume (forced by atmosphere/ocean impact on ocean)
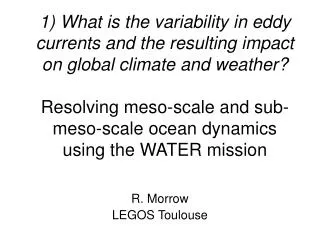
Climate Variability • Two examples are discussed in the following: • The Southern Annular Mode (SAM), which is most likely the dominant mode of atmospheric variability in the Southern Hemisphere followed by ENSO teleconnections • AnSlope: A program to study the (Ross) shelf / slope exchange process
The Southern Annular Mode Changes in the Subpolar to Subtropical Atmospheric Pressure Difference lead to: • Changes in strength and positionof the westerly winds • Phase can be describedby see level pressure based index http://horizon.atmos.colostate.edu/ao/ResPapers/SHAM.html 850-hPa height regressed on an index of the SAM
The Southern Annular Mode Names for the same or related phenomena: • “High Latitude Mode” (Kidsen, 1978 ) • “Antarctic Oscillation” (Thompson and Wallace, 1998) • “Southern Hemispheric Annular Mode” SHAM (Hartman 2001)
SLP station data based index for the Southern Annular Mode • Average all data in two zonal bands and compute a first guess SAM index. • Correlate all stations with the first guess index.
SLP station data based index for the Southern Annular Mode • Average all data in two zonal bands and compute a first guess SAM index. • Correlate all stations with the first guess index. • Divide the subtropics into three regions and generate averaged pressure anomaly index for each region. • Compute pressure anomaly index for Antarctic stations.
The SAM index Africa missing
Station SLP based regional correlations with the SAM index For Ross Sea studies the Australia Index might be preferred.
Observed wind stress impacts of SAM Note: correlation near Ross Sound suggest more winds from west during positive SAM phase Surface air temp.
SAM Impacts • Impacts of changes in the strength of the circumpolar wind system: • Sea Ice • Water mass properties • These results are suggestive and need long term observations to be fully confirmed
Observed sea ice impacts of SAM Correlation with observed sea ice concentration
Observed sea ice impacts of SAM Correlation with observed sea ice concentration Ross Sea: SAM+ => less icelarge polynias?
Water mass changes in the Weddell CORC - ARCHES Observing system in the North Western Weddell Gyre. Document changes in deep water formation of the Southern Ocean. Moorings and annual hydrographic survey. Observed warming of the Warm Deep Water Robertson et al 2002;
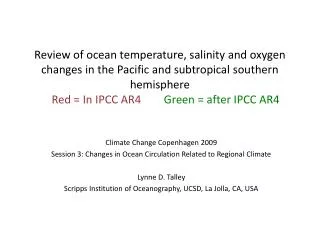
Water mass changes in the Ross The waters in the Ross Sea sector are warming and freshening Jacobs et al 2003
Ross Sea Shelf • Climate variability on the Ross Sea Shelf has not received much study. • Some recent studies suggest large changes in the amount of high salinity shelf water produced as a direct consequence of atmospheric forcing variability • ECMWF and other atmospheric reanalysis are getting to the point that they might be helpful • High resolution sea ice extent data are more available • Some historical CTD data exist
Ross Sea Sound CTD • Data coverage at a depth of 250m in the LDEO historical CTD data archive • Notice that in the Ross Sound there are only a few sites covered
Ross Sea Sound CTD • Time distribution of TS data in “Ross Sound + area” • Notice the sparse sampling • An LTER could make a big difference
Ross Sea High Salinity Shelf Water • High Salinity Shelf water is formed in the main Ross Sea polynias. • Terra Nova Bay is the “most productive”, but other have not been studies as much. • Where does the bottom water go?
AnSlope Program2002-2005 AnSlope's primary goal is to identify the principal physical processes that govern the transfer of shelf-modified dense water into intermediate and deep layers of the adjacent deep ocean. At the same time, we seek to understand the compensatory poleward flow of waters from the oceanic regime. We identify the upper continental slope as the critical gateway for the exchange of shelf and deep ocean waters.
ANSLOPE elements three NBP cruises to the slope front area (2003,2004 Feb-April, 2004 Oct-Dec) two year long deployments of a moored array (2003-2005)
ANSLOPE hypothesis high salinity shelf water formed in large parts in the Terra Nova Bay polynia. slope front processes modify properties prior to reaching open ocean red arrows denote bottom circulation ofhigh salinity shelf water
Anslope-2 CTD findings23 Feb - 9 April 2004 • Obtained 232 CTD/LADCP stations • Focus on the generation of the three outflow plumes • Sampled the shelf break frontal regime in 33 “sections” (lines of tightly spaced stations)
Sections • Drygalski Trough high salinity shelf water • notice the difference between shelf and “open ocean” conditions
Bottom Plume Summary We traced the hydrographic conditions of the various overflow plumes along the shelf break region of the western Ross. Highest oxygen and strongest flows were found for the Drygalski plume. Drygalski Joides Glomar Challenger
McM LTER ideas A • Long term observations using moored technology: - anchored to the bottom in the seasonal ice covered waters (can be deployed for a two year duration and serviced by CG ice breaker) - anchored to the fast ice with real time data telemetry. (serviced by land access from McMurdo) • Benefits: - proven technology - relatively easy to do • Issues: - bottom moored will miss near surface layer - once a year data return
McM LTER ideas B • Seasonal observations using sea glider technology: - sea glider can be launched through the fast ice or by ship - sea glider can provide real time data and do surveys - sea glider can “meet the ship” for end of season pickup. • Benefits: - surveys possible - complete coverage of euphotic zone - Chl-A and PAR sensor available • Issues: - cutting edge technology - sea ice might be an issue (but experience exists)
McM LTER large scale view www.oceantimeseries.org • A McM Sound LTER should be seen as a part of the global array of ocean time series stations. • LDEO has just deployed a pilot mooring to look at the Ross Sea outflow past the shelf break. (NSF proposal under review)