Download
1 / 31
310 likes | 318 Views
Target Industry Cluster Analysis. Tri-County Region, North Dakota. 01. 02. 03. Overview. Target Industry Cluster. Table of contents. Industry Cluster Analysis. 01 overview. Tri-County Region, ND . Overview. Tricounty Region.

E N D
Target Industry Cluster Analysis Tri-County Region, North Dakota
01 02 03 Overview Target Industry Cluster Table of contents Industry Cluster Analysis
01 • overview • Tri-County Region, ND
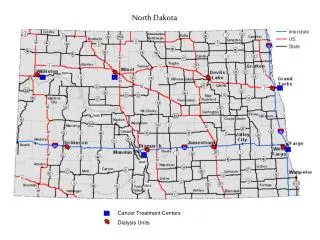
Overview Tricounty Region • The Tricounty Region is comprised of three North Dakota counties. U.S. State Route 83 passes through the western part of the region connecting to I-94 to the north. • Emmons • Logan • McIntosh section 01
02 • industry cluster analysis Tri-County Region, ND
Industry cluster analysis How to interpret cluster data resultsThe graph’s four quadrants tell a different story for each cluster. Contains clusters that are more concentrated in the region and are growing. These clusters are strengths that help a community stand out from the competition. Small, high-growth clusters can be expected to become more dominant over time. Contains clusters that are more concentrated in the region but are declining (negative growth). These clusters typically fall into the lower quadrant as job losses cause a decline in concentration. Mature Top left (strong but declining) Stars Top right (strong and advancing) Emerging Bottom right (weak but advancing) Transforming Bottom left (weak and declining) Contains clusters that are under-represented in the region (low concentration) and are also losing jobs. Clusters in this region may indicate a gap in the workforce pipeline if local industries anticipate a future need. In general, clusters in this quadrant show a lack of competitiveness. Contains clusters that are under-represented in the region but are growing, often quickly. If growth trends continue, these clusters will eventually move into the top right quadrant. Clusters in this quadrant are considered emerging strengths for the region. section 02 • Modified from: http://www.charlestonregionaldata.com/bubble-chart-explanation/
Industry and occupation Industry cluster bubble chart 12 Mature Star Transforming Emerging Note: Glass & Ceramics and Apparel & Textiles clusters have too few jobs section 02 • Source: EMSI Class of Worker 2014.4 (QCEW, non-QCEW, self-employed and extended proprietors). • Note: Label includes cluster name, LQ 2014, and Employment 2014; NAICS 2012 definitions
Industry and occupation Manufacturing sub-cluster bubble chart Star Mature Transforming Emerging Note: Primary Metal Manufacturing, Computer & Electronic Product Manufacturing and Electrical Equipment, Appliance & Component Manufacturing sub-clusters do not exist in the region. section 02 • Source: EMSI Class of Worker 2014.4 (QCEW, non-QCEW, self-employed and extended proprietors). • Note: Label includes cluster name, LQ 2014, and Employment 2014; NAICS 2012 definition
Industry cluster analysis Level of Specialization Percent Growth in Specialization Note: Primary Metal Manufacturing, Computer & Electronic Product Manufacturing and Electrical Equipment, Appliance & Component Manufacturing sub-clusters do not exist in the region. Glass & Ceramics and Apparel & Textiles clusters have too few jobs. section 02 * Numbers in parenthesis include location quotient and employment in 2014.
Industry and occupation Bubble chart interpretation Star Industries Star industry clusters are highly concentrated, exporting and still experiencing growth in the region. The most highly concentrated of the Star industry clusters in the Tricounty Region is Agribusiness, Food Processing & Technology. Its location quotient is 10.78, indicating that the cluster is 10 times more concentrated in the region compared to the U.S. The other strong cluster in the region is Mining. Emerging Industries Industry clusters that may be poised for future growth are classified as “Emerging.” There are eight Emerging clusters in the Tricounty Region. Top three that has the highest LQ are Energy(Fossil & Renewable), Transportation & Logistics, and Forest & Wood Products. The other clusters include Printing & Publishing, Business & Financial Services, Defense & Security, Education & Knowledge Creation, and Fabricated Metal Product manufacturing. Mature Industries Two industry clusters in the Tricounty Region are in the Maturing stage: Biomed/Biotechnical (Life Science) and Machinery Manufacturing. These industries are relatively concentrated, but their growth is trending downward. It is worth noting, however, that the Tricounty Region may find it worthwhile to invest in efforts to shore up the concentration of these industries. Transforming Industries Transforming clusters capture the mix of industries that are experiencing relative decline and limited export capability. In the Tricounty Region, Transportation Equipment Mfg., Chemicals/Chemical-based Products, Manufacturing Supercluster, Arts, Entertainment, Recreational & Visitor Industries, Advanced Materials, Information Technology & Telecommunications, are all Transforming clusters. Any amount of growth in these industries would require relatively large investments. section 02 • Source: EMSI Class of Worker 2014.4 (QCEW, non-QCEW, self-employed and extended proprietors).
03 • target industry cluster Biomedical/Biotechnical (Life Sciences) Business and Financial Service Education And Knowledge Creation Arts, Entertainment, Recreation And Visitor Industries
Biomedical/Biotechnical (Life Sciences) Cluster Shift-Share Analysis by Top Industry Sectors: Tri-County Region, ND Note: Upward arrow ( ) indicates regional competitiveness. EMSI estimates do not show sufficient number of jobs for Medical, Dental, and Hospital Equipment and Supplies Merchant Wholesalers; Cosmetics, Beauty Supplies, and Perfume Stores; Research and Development in the Physical, Engineering, and Life Sciences (except Biotechnology); All Other Miscellaneous Ambulatory Health Care Services; and Residential Intellectual and Developmental Disability Facilities. section 03 • Source: EMSI Class of Worker 2014.4 (QCEW, non-QCEW, self-employed and extended proprietors).
Biomedical/Biotechnical (Life Sciences) Cluster Top 15 Inputs by Dollars: Tri-County Region, ND Note: * industry sector has less than 10 jobs as calculated by EMSI; ** industry sector is not present in the region. section 03 • Source: EMSI Class of Worker 2014.4 (QCEW, non-QCEW, self-employed and extended proprietors).
Biomedical/Biotechnical (Life Sciences) Cluster Top 15 Inputs by Dollars: Tri-County Region, ND Note: * industry sector has less than 10 jobs as calculated by EMSI. section 03 • Source: EMSI Class of Worker 2014.4 (QCEW, non-QCEW, self-employed and extended proprietors).
Biomedical/Biotechnical (Life Sciences) Cluster Top Occupations: Tri-County Region, ND Note: SOC (Standard Occupation Classification) 5-digit occupations are included by jobs in 2014. EMSI estimates do not show sufficient number of jobs for Nurse Practitioners; Cooks, Short Order; Nurse Anesthetists; Radiologic Technologists; Food Preparation Workers; and First-Line Supervisors of Food Preparation and Serving Workers. section 03 • Source: EMSI Class of Worker 2014.4 (QCEW, non-QCEW, self-employed and extended proprietors).
Business and Financial Service Cluster Shift-Share Analysis by Top Industry Sectors: Tri-County Region, ND Note: Upward arrow ( ) indicates regional competitiveness. EMSI does not show jobs for All Other Non-depository Credit Intermediation; Trust, Fiduciary, and Custody Activities ; and Claims Adjusting. section 03 • Source: EMSI Class of Worker 2014.4 (QCEW, non-QCEW, self-employed and extended proprietors).
Business and Financial Service Cluster Top 15 Inputs by Dollars: Tri-County Region, ND Note: * industry sector has less than 10 jobs as calculated by EMSI; ** industry sector is not present in the region. section 03 • Source: EMSI Class of Worker 2014.4 (QCEW, non-QCEW, self-employed and extended proprietors).
Business and Financial Service Cluster Top 15 Inputs by Dollars: Tri-County Region, ND Note: * industry sector has less than 10 jobs as calculated by EMSI. section 03 • Source: EMSI Class of Worker 2014.4 (QCEW, non-QCEW, self-employed and extended proprietors).
Business and Financial Service Cluster Top Occupations: Tri-County Region, ND Note: SOC (Standard Occupation Classification) 5-digit occupations are included by jobs in 2014. EMSI estimates do not show sufficient number of jobs for Software Developers, Applications; Web Developers; File Clerks; Computer User Support Specialists; Computer Programmers; Loan Interviewers and Clerks; Financial Specialists, All Other; Appraisers and Assessors of Real Estate; and Business Operations Specialists, All Other. section 03 • Source: EMSI Class of Worker 2014.4 (QCEW, non-QCEW, self-employed and extended proprietors).
Education And Knowledge Creation Cluster Shift-Share Analysis by Top Industry Sectors: Tri-County Region, ND Note: Upward arrow ( ) indicates regional competitiveness. EMSI does not show any jobs for Book Publishers; Professional and Management Development Training; Fine Arts Schools; Sports and Recreation Instruction; Automobile Driving Schools; and Educational Support Services section 03 • Source: EMSI Class of Worker 2014.4 (QCEW, non-QCEW, self-employed and extended proprietors).
Education And Knowledge Creation Cluster Top 15 Inputs by Dollars: Tri-County Region, ND Note: * industry sector has less than 10 jobs as calculated by EMSI; ** industry sector is not present in the region. section 03 • Source: EMSI Class of Worker 2014.4 (QCEW, non-QCEW, self-employed and extended proprietors).
Education And Knowledge Creation Cluster Top 15 Inputs by Dollars: Tri-County Region, ND Note: * industry sector has less than 10 jobs as calculated by EMSI. section 03 • Source: EMSI Class of Worker 2014.4 (QCEW, non-QCEW, self-employed and extended proprietors).
Education And Knowledge Creation Cluster Top Occupations: Tri-County Region, ND Note: SOC (Standard Occupation Classification) 5-digit occupations are included by jobs in 2014. EMSI does not show sufficient number of jobs for detailed 5-digit SOC occupations. section 03 • Source: EMSI Class of Worker 2014.4 (QCEW, non-QCEW, self-employed and extended proprietors).
Education And Knowledge Creation Cluster Top Occupations: Tri-County Region, ND Note: SOC (Standard Occupation Classification) 3-digit occupations are included by jobs in 2014. EMSI does not show sufficient number of jobs for occupations other than Media and Communication Workers. section 03 • Source: EMSI Class of Worker 2014.4 (QCEW, non-QCEW, self-employed and extended proprietors).
Arts, Entertainment, Recreation And Visitor Industries Cluster Shift-Share Analysis by Top Industry Sectors: Tri-County Region, ND Note: Upward arrow ( ) indicates regional competitiveness. EMSI does not show sufficient number of jobs for Motion Picture Theaters (except Drive-Ins); Other Spectator Sports; Agents and Managers for Artists, Athletes, Entertainers, and Other Public Figures; Historical Sites; Other Gambling Industries; Fitness and Recreational Sports Centers; All Other Amusement and Recreation Industries; All Other Traveler Accommodation; and Recreational and Vacation Camps (except Campgrounds). section 03 • Source: EMSI Class of Worker 2014.4 (QCEW, non-QCEW, self-employed and extended proprietors).
Arts, Entertainment, Recreation And Visitor Industries Cluster Top 15 Inputs by Dollars: Tri-County Region, ND Note: * industry sector has less than 10 jobs as calculated by EMSI; ** industry sector is not present in the region. section 03 • Source: EMSI Class of Worker 2014.4 (QCEW, non-QCEW, self-employed and extended proprietors).
Arts, Entertainment, Recreation And Visitor Industries Cluster Top 15 Inputs by Dollars: Tri-County Region, ND Note: * industry sector has less than 10 jobs as calculated by EMSI. section 03 • Source: EMSI Class of Worker 2014.4 (QCEW, non-QCEW, self-employed and extended proprietors).
Arts, Entertainment, Recreation And Visitor Industries Cluster Top Occupations: Tri-County Region, ND Note: SOC (Standard Occupation Classification) 5-digit occupations are included by jobs in 2014. EMSI does not show sufficient number of jobs for detailed 5-digit SOC occupations. section 03 • Source: EMSI Class of Worker 2014.4 (QCEW, non-QCEW, self-employed and extended proprietors).
Arts, Entertainment, Recreation And Visitor Industries Cluster Top Occupations: Tri-County Region, ND Note: SOC (Standard Occupation Classification) 3-digit occupations are included by jobs in 2014. EMSI does not show sufficient number of jobs for occupations other than Entertainers and Performers, Sports and Related Workers; Other Personal Care and Service Workers; and Other Management Occupations. section 03 • Source: EMSI Class of Worker 2014.4 (QCEW, non-QCEW, self-employed and extended proprietors).
Report ContributorsThis report was prepared by the Purdue Center for Regional Development, in partnership with the Southern Rural Development Center and USDA Rural Development, in support of the Stronger Economies Together program. Report Authors Bo Beaulieu, PhD Indraneel Kumar, PhD Andrey Zhalnin, PhD Data Analysis Ayoung Kim Francisco Scott Report Design Tyler Wright This report was supported, in part, by grant from the USDA Rural Development through the auspices of the Southern Rural Development Center. It was produced in support of the Stronger Economies Together (SET) program.
For more information, • please contact: • Dr. Bo Beaulieu, • PCRD Director: • ljb@purdue.edu • Or • 765-494-7273 The Purdue Center for Regional Development (PCRD) seeks to pioneer new ideas and strategies that contribute to regional collaboration, innovation and prosperity. June 2015