Download
1 / 18
180 likes | 195 Views
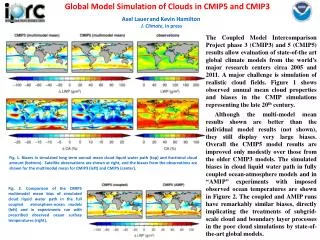
This study analyzes the regional climate change in Asia, comparing historical simulations with observations and projecting future climate changes using CMIP5 models. It focuses on temperature and precipitation changes in different regions of Asia.

E N D
Regional and Subregional Asian climate simulation and projection based on CMIP5 2nd CORDEX South Asia Science Workshop Dong Wenjie Guo Yan Wei Xin Shi Wen Hu Jiacong 2013.8.28 Kathmandu
Introduction 1 Outline Models and Data 2 Simulation and projection 3 Conclusions 4
Introduction • Regional climate change has profound effects on local production and life, which is of great significance. • GCMs are a good tool in climate simulation and projection, however large uncertainty is indeed unavoidable in regional climate simulation. Regional climate change simulation and projection is still a big challenge until now. • CMIP5 climate models are the most advanced generation of climate models, having relatively high resolutions. Some are earth system models, having complete components (atmospheric chemistry, carbon cycle, etc) .
Research issues 1. What is the regional climate change during the past 100 yr over Asia? And what about the simulation for these historical climate change features? ---To compare CMIP5 historical simulations (1901-2005) with observations over several Asian regions, and analyze simulation uncertainties. 2. What is future regional climate change over Asia? ---To project future climate changes under several RCPs (2006-2100) over several Asian regions. • Time-scale: annual / seasonal mean
Data and CMIP5 models Observation data: high-resolution monthly CRU 2m air temperature dataset (1901-2005) CMAP monthly precipitation dataset (1979-2005) 20 CMIP5 models: 4 kinds of experiments: Historical simulation (1901-2005) RCP2.6/4.5/8.5 (2006-2100)
Climate Projection under RCPs High-concentration Pathway Mid-concentration Pathway RCP2.6: Low-concentration Pathway
Definition of Regions Giorgi and Francisco (2000),GRL North Asia (NA): 50N-70N, 40E-180E East Asia (EA): 20N-50N, 100E-140E Tibet (TIB): 30N-50N, 75E-100E Central Asia (CA): 30N-50N, 40E-75E South Asia (SA): 5N-30N, 65E-100E Southeast Asia (SEA): 10S-20N, 95E-155E Asia:
Results: T2m Regional mean T2m anomaly (1901-2005) Asia relative to 1970-1999 EA CA TIB SA SEA
Linear Trends of T2m (℃ /100a) : simulation .VS. obs. underestimation
Distribution of T2m climatology over SA (b) (a) (c) • 1970-1999 mean T2m over SA from CRU • Simulated T2m climatology bias (MME minus observation) • Taylor diagram for simulated spatial distribution of T2m climatology
Seasonal mean T2m anomaly over SA Linear trend (℃ /100a) : CRU MME Multi-model STD Augest: 0.54 0.65 0.29 Winter: 0.74 0.68 0.35 CRU MME Multi-model STD Spring: 0.6 0.8 0.32 Summer: 0.22 0.5 0.26
Future projection: regional mean T2m anomaly to 2100 Asia CA EA SEA TIB SA CRU RCP4.5(MME) RCP8.5(MME) Historical(MME) RCP2.6(MME)
Future T2m changes T2m changes compare to 1970-1999 mean (℃)
Results: precipitation Regional mean precipitation anomaly (1979-2100) Asia CA EA CMAP: 0.16 mm/day/100a MME: 0.2mm/day/100a CMAP: 0.3 mm/day/100a MME: 0.4 mm/day/100a SEA TIB SA CMAP RCP4.5(MME) RCP8.5(MME) Historical(MME) RCP2.6(MME)
Future precipitation changes Precipitation changes compare to 1970-1999 mean (%)
Conclusions 1 • CMIP5 models can generally simulate the observed warming over several Asia regions and the whole Asia, but underestimate the swift warming occurred after the 1970s. • The mid-high latitudes Asia have experienced stronger warming than the subtropical Asia; the warming contrast between central and southern Asia is underestimated with CMIP5. • For South Asia, simulations for the spatial distribution of T2m climatology fit relatively well. However, underestimations in T2m are found all over, and the largest cold bias is found in the Tibet region.
Conclusions 2 • In future, continuous warming is projected under RCP2.6/4.5/8.5 over individual Asian regions; the warming contrast of stronger warming in central than in southern Asia goes on. Relative small multi-model spread is found in the projection of temperature over SA and SEA regions. • TIB and SA had increased precipitation from 1979 to 2005, which are reasonably captured by MME simulation, in contrast to the simulations over other Asian regions and the whole Asia. CMIP5 models project increased precipitation over Asian regions except CA, and the largest increase is in the Tibet region.