Download
1 / 8
80 likes | 185 Views
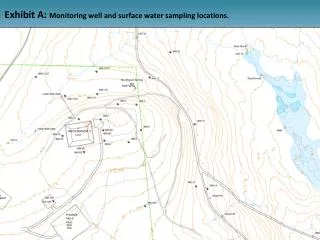
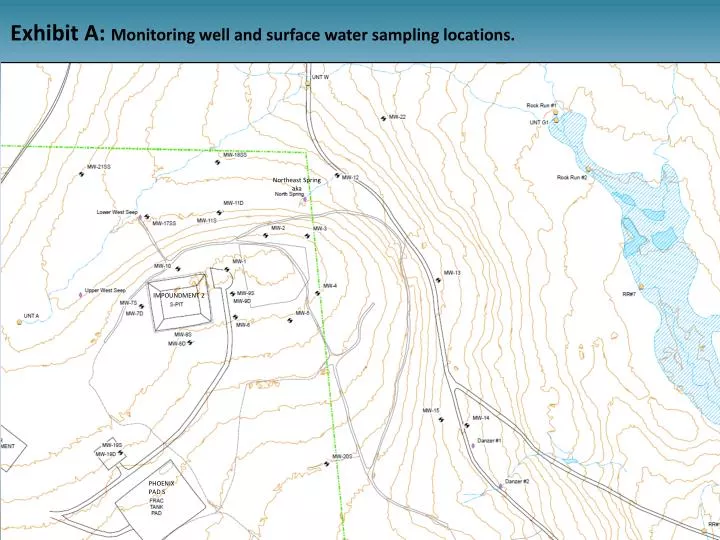
Exhibit A: Monitoring well and s urface w ater s ampling locations. Northeast Spring aka. IMPOUNDMENT 2. PHOENIXPAD S. Exhibit B: EQT Phoenix Pad S site overview. Photo taken 5/31/13. EQT Phoenix Pad S. Pad R Impoundments. Impoundment 2. Drainage channel. West Seeps.

E N D
Exhibit A: Monitoring well and surface water sampling locations. Northeast Spring aka IMPOUNDMENT 2 PHOENIXPAD S
Exhibit B: EQT Phoenix Pad S site overview. Photo taken 5/31/13. EQT Phoenix Pad S Pad R Impoundments Impoundment 2 Drainage channel West Seeps Proposed Centralized Impoundment Location
Exhibit C: View of Impoundment 2 looking SE. West Seeps impacted area in foreground. Photo taken 8/2/12.
Exhibit F: Groundwater chloride concentrations in mg/L- May 30, 2012. Secondary Maximum Contaminant Level (SMCL) is 250 mg/L.
Exhibit G: Groundwater chloride concentrations in mg/L - June 25, 2014, Secondary Maximum Contaminant Level (SMCL) is 250 mg/L. Insert chloride isoconcentration May 2014 map when get data